> ## Documentation Index
> Fetch the complete documentation index at: https://docs.goguardian.com/llms.txt
> Use this file to discover all available pages before exploring further.
# Understand Screen Time Insights
> Review average daily active Screen Time by user, school context, organizational unit, classroom, operating system, app, category, and approval status.
**Screen Time Insights** shows average daily active web browsing time per user and the apps, categories, groups, and school contexts associated with that activity. Use it to compare Screen Time across a selected date range and scope.
Every Discover user can open **Screen Time Insights**.
## Understand How Screen Time Is Measured
Screen Time measures web browsing while a browser tab is active and in focus. Background tabs do not accumulate Screen Time, and only 1 tab in 1 browser window can be in focus at a time.
Screen Time currently has no idle-time cutoff. A focused tab can continue accumulating Screen Time while the device is idle. Closing the browser or device lid, putting the device to sleep, or losing connectivity stops new Screen Time from accumulating.
Screen Time data is processed nightly. Activity from today may not appear until the following day.
## Filter Screen Time Insights
The default date range is **Last 30 days**. Use these filters to change the scope of every chart and table on the page:
* **Schools**
* **OUs**
* **OSes**
* **Classrooms**
* **Date**
Click **Reset All** to clear the Schools, OUs, OSes, and Classrooms filters and restore **Last 30 days**.
## Review Screen Time Trends
The **Screen Time Trends** chart displays average daily active Screen Time per unique user. Its primary value is labeled **Per User per Day**.
The chart separates the average into:
* **In School**
* **Out of School**
* **Undetermined**
**Avg. Daily Time** always equals **Avg. In School** plus **Avg. Out of School** plus **Avg. Undetermined**. Displayed durations are rounded to the nearest minute, while calculations use unrounded values.
The user count at the bottom of the chart shows how many unique users are included. The percentage change compares the selected period with the immediately preceding period of equal length.
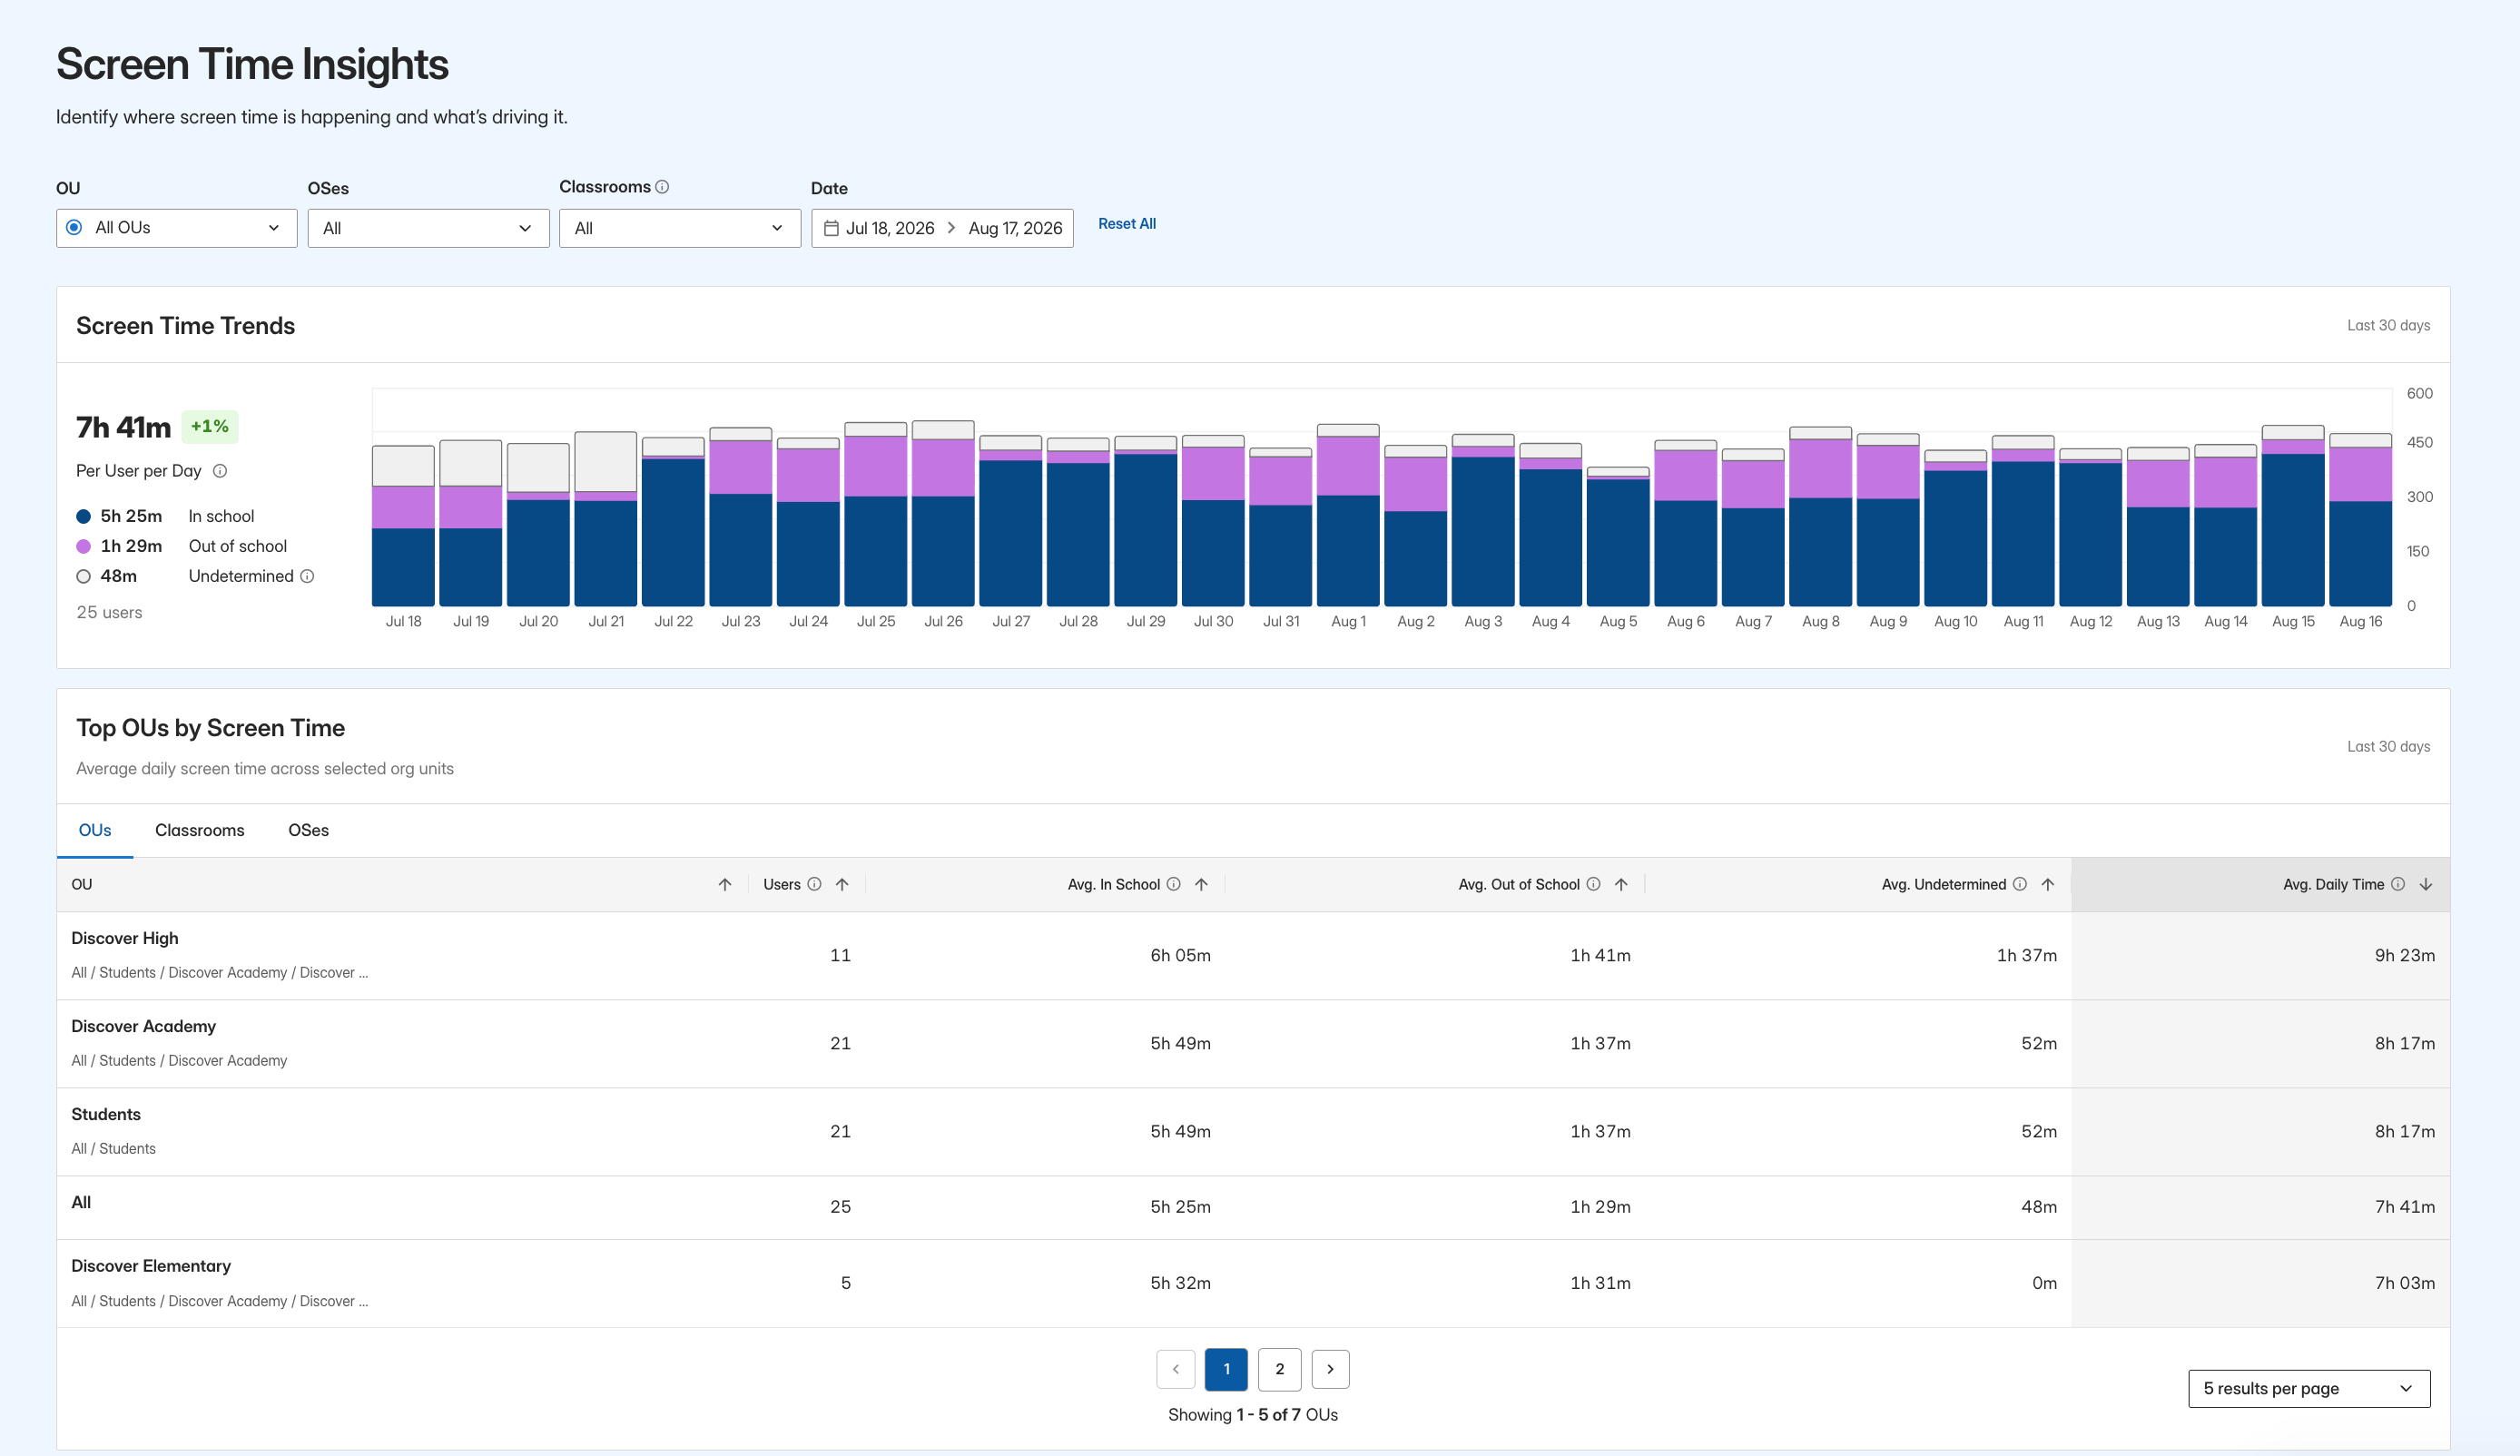 The **Per User per Day** tooltip reads: “Average daily active screen time per user across all browsing activity during the selected date range, including websites and apps not currently tracked in Discover. When available, active screen time is separated into in-school and out-of-school activity.”
## Interpret School Context
Discover assigns each browsing activity 1 of these categories when the activity is processed:
| Category | Meaning |
| ------------- | ----------------------------------------------------------------------------------------------------------------- |
| In School | The GoGuardian App or extension identified the browsing as in-school activity. |
| Out of School | The GoGuardian App or extension identified the browsing as out-of-school activity. |
| Undetermined | The GoGuardian App or extension could not provide an in-school or out-of-school label when the browsing occurred. |
The category is fixed when the activity is processed. Later changes to **In School Hours** or **School IP Ranges** do not reclassify historical activity.
Browsing can be **Undetermined** when it was collected by an older version of The GoGuardian App or extension, when a temporary network or processing issue prevented classification, or when the organization did not have the required school information configured.
The **Undetermined** tooltip reads: “Screen time that couldn't be determined to be in school or out of school because the required information wasn't available.”
See [Configure At Home Mode](/products/org-management/at-home-mode) for information about **In School Hours** and **School IP Ranges**.
## Compare Screen Time by Group
**Top OUs by Screen Time** displays average daily Screen Time by organizational unit. Select the **OUs**, **Classrooms**, or **OSes** tab to change the grouping, table heading, and first column.
The table includes:
* **Users**
* **Avg. In School**
* **Avg. Out of School**
* **Avg. Undetermined**
* **Avg. Daily Time**
The table sorts by **Avg. Daily Time** in descending order by default. Users can sort the other columns and move between pages. The table does not provide search or a results-per-page setting.
## Review Apps, Categories, and Approval Status
The lower section of **Screen Time Insights** includes:
* **Top Categories by % of Total Screen Time**
* **Screen Time by App Approval Status**
* **Top Apps by Screen Time**
The **Per User per Day** tooltip reads: “Average daily active screen time per user across all browsing activity during the selected date range, including websites and apps not currently tracked in Discover. When available, active screen time is separated into in-school and out-of-school activity.”
## Interpret School Context
Discover assigns each browsing activity 1 of these categories when the activity is processed:
| Category | Meaning |
| ------------- | ----------------------------------------------------------------------------------------------------------------- |
| In School | The GoGuardian App or extension identified the browsing as in-school activity. |
| Out of School | The GoGuardian App or extension identified the browsing as out-of-school activity. |
| Undetermined | The GoGuardian App or extension could not provide an in-school or out-of-school label when the browsing occurred. |
The category is fixed when the activity is processed. Later changes to **In School Hours** or **School IP Ranges** do not reclassify historical activity.
Browsing can be **Undetermined** when it was collected by an older version of The GoGuardian App or extension, when a temporary network or processing issue prevented classification, or when the organization did not have the required school information configured.
The **Undetermined** tooltip reads: “Screen time that couldn't be determined to be in school or out of school because the required information wasn't available.”
See [Configure At Home Mode](/products/org-management/at-home-mode) for information about **In School Hours** and **School IP Ranges**.
## Compare Screen Time by Group
**Top OUs by Screen Time** displays average daily Screen Time by organizational unit. Select the **OUs**, **Classrooms**, or **OSes** tab to change the grouping, table heading, and first column.
The table includes:
* **Users**
* **Avg. In School**
* **Avg. Out of School**
* **Avg. Undetermined**
* **Avg. Daily Time**
The table sorts by **Avg. Daily Time** in descending order by default. Users can sort the other columns and move between pages. The table does not provide search or a results-per-page setting.
## Review Apps, Categories, and Approval Status
The lower section of **Screen Time Insights** includes:
* **Top Categories by % of Total Screen Time**
* **Screen Time by App Approval Status**
* **Top Apps by Screen Time**
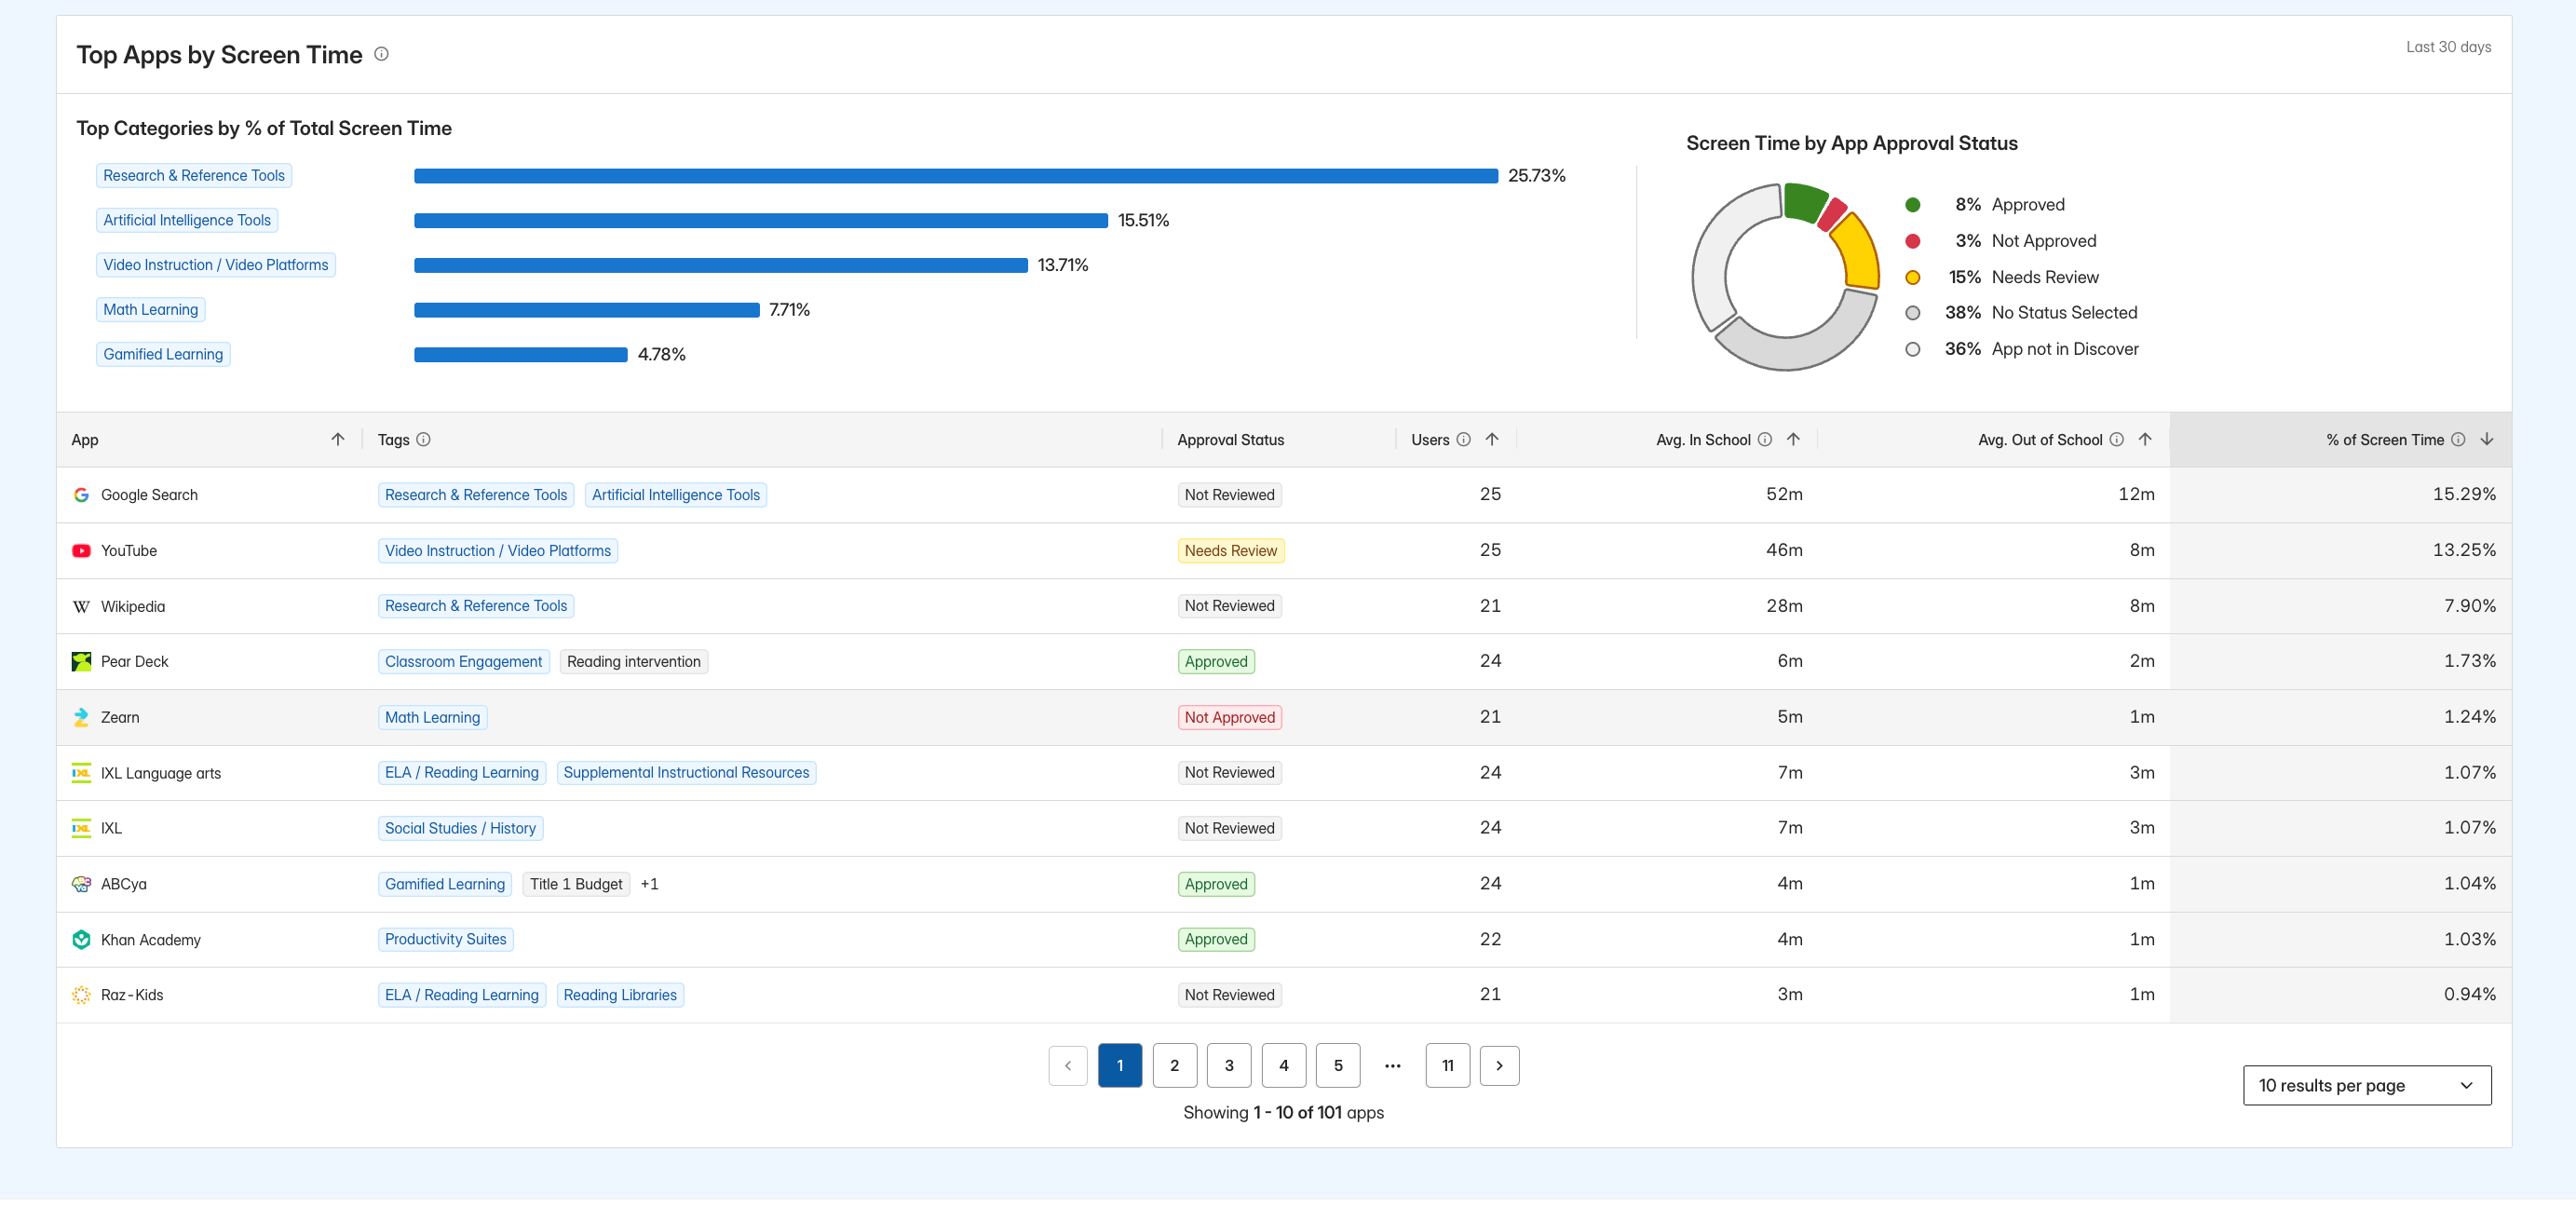 **Top Categories by % of Total Screen Time** includes only apps categorized in Discover. **Screen Time by App Approval Status** includes **App not in Discover** for browsing that cannot be mapped to an app in the Discover catalog.
In **Top Apps by Screen Time**, **% of Screen Time** is each app's share of all Screen Time. Its denominator includes browsing associated with apps that are not captured in Discover and activity classified as **Undetermined**.
The app table includes:
* **App**
* **Tags**
* **Approval Status**
* **Users**
* **Avg. In School**
* **Avg. Out of School**
* **% of Screen Time**
The table does not show **Avg. Undetermined** as a separate app-level column. That activity remains included in the Screen Time denominator.
**Top Apps by Screen Time** sorts by **% of Screen Time** in descending order by default. Users can sort every column except **Tags** and **Approval Status**, move between pages, and click an app name to open its **App Details** page. The table does not provide search or a results-per-page setting.
Chart segments, categories, approval statuses, and values other than app names are not interactive.
## Resolve Missing Screen Time Data
When no activity matches the selected scope, each affected chart or table displays:
> No Screen Time Data Found. Try adjusting filters or timeframe to view screen time activity.
Change or reset the filters and confirm that the selected date range includes processed activity.
## Review Export Availability
**Screen Time Insights** does not provide an export button.
## Resources
* [Configure At Home Mode](/products/org-management/at-home-mode)
* [Browse App Catalog](/products/discover/browse-app-catalog)
* [Review App Catalog Fields](/products/discover/review-app-catalog-fields)
**Top Categories by % of Total Screen Time** includes only apps categorized in Discover. **Screen Time by App Approval Status** includes **App not in Discover** for browsing that cannot be mapped to an app in the Discover catalog.
In **Top Apps by Screen Time**, **% of Screen Time** is each app's share of all Screen Time. Its denominator includes browsing associated with apps that are not captured in Discover and activity classified as **Undetermined**.
The app table includes:
* **App**
* **Tags**
* **Approval Status**
* **Users**
* **Avg. In School**
* **Avg. Out of School**
* **% of Screen Time**
The table does not show **Avg. Undetermined** as a separate app-level column. That activity remains included in the Screen Time denominator.
**Top Apps by Screen Time** sorts by **% of Screen Time** in descending order by default. Users can sort every column except **Tags** and **Approval Status**, move between pages, and click an app name to open its **App Details** page. The table does not provide search or a results-per-page setting.
Chart segments, categories, approval statuses, and values other than app names are not interactive.
## Resolve Missing Screen Time Data
When no activity matches the selected scope, each affected chart or table displays:
> No Screen Time Data Found. Try adjusting filters or timeframe to view screen time activity.
Change or reset the filters and confirm that the selected date range includes processed activity.
## Review Export Availability
**Screen Time Insights** does not provide an export button.
## Resources
* [Configure At Home Mode](/products/org-management/at-home-mode)
* [Browse App Catalog](/products/discover/browse-app-catalog)
* [Review App Catalog Fields](/products/discover/review-app-catalog-fields)