> ## Documentation Index
> Fetch the complete documentation index at: https://docs.goguardian.com/llms.txt
> Use this file to discover all available pages before exploring further.
# Insights: Performance by Students
> Review student proficiency distribution by class or demographic and compare individual scores against district, school, and class-wide averages.
The Performance by Students report identifies groups of students by proficiency level to gauge the next steps or develop differentiated paths.
## Insights: Performance by Students in Pear Assessment
The Performance by Students report identifies groups of students by proficiency level to gauge the next steps or develop differentiated paths. The data lets administrators and teachers:
* Review the distribution of proficiency for all students who attempted the assessment
* Compare student proficiency distribution in each class
* Review student performance, including peer comparison with the district, school, and class-wide average score (%)
* Filter results by test, class, performance, and demographic
## Review Performance by Students Profile
1. Click **Insights** in the navigation menu.
2. Click **Performance by Students** under **Single Assessment Report**.
 3. Select relevant filters to narrow your reporting scope.
 4. Review student score distribution based on performance band.
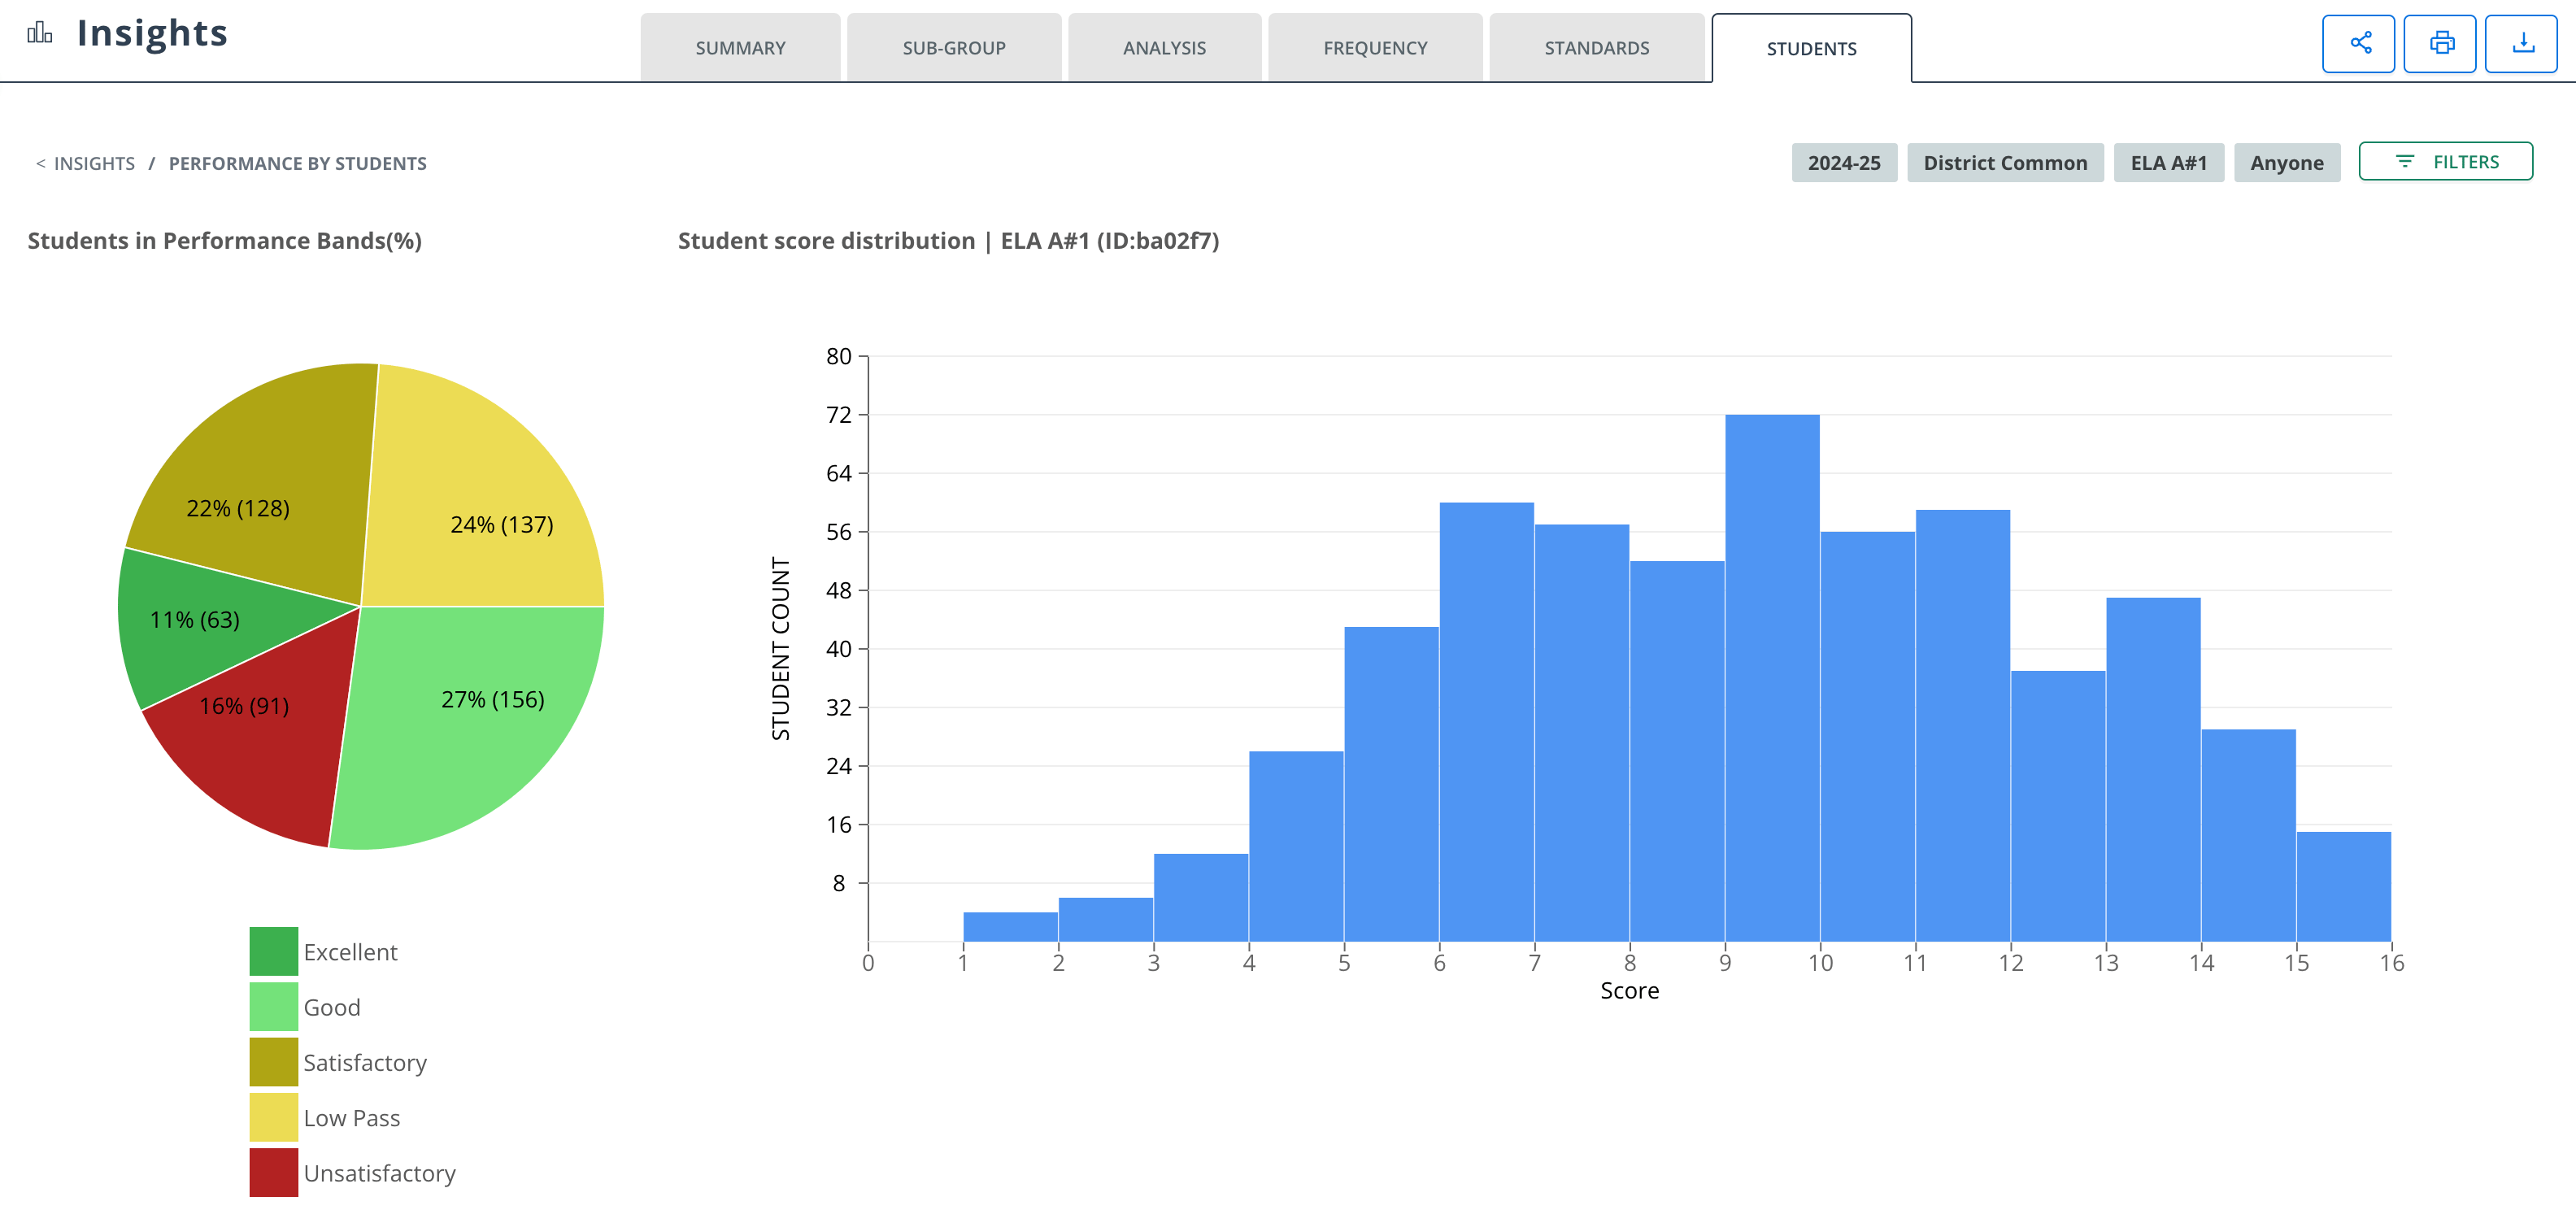 5. Review assessment scores relative to the performance band. You can filter by band in the upper-right corner of the table.
