> ## Documentation Index
> Fetch the complete documentation index at: https://docs.goguardian.com/llms.txt
> Use this file to discover all available pages before exploring further.
# Insights: Question Analysis Report
> Use the Question Analysis report to compare student scores, time spent, and performance across questions and classes
The Question Analysis report identifies the most difficult questions for students. Teachers and administrators can use it to compare scores and time spent per question, view associated standards and points, and filter results by test, class, performance, and demographic.
## What You Can Do in Question Analysis
* Compare the score (%) and time spent by students per question
* View standards and points associated with a question
* Compare average performance between classes on an individual question
* Preview any question by clicking on it
* Filter results by test, class, performance, and demographic
## Review the Question Analysis Report
1. In Pear Assessment, click **Insights** in the navigation menu.
2. Click **Question Analysis** under **Single Assessment Report**.
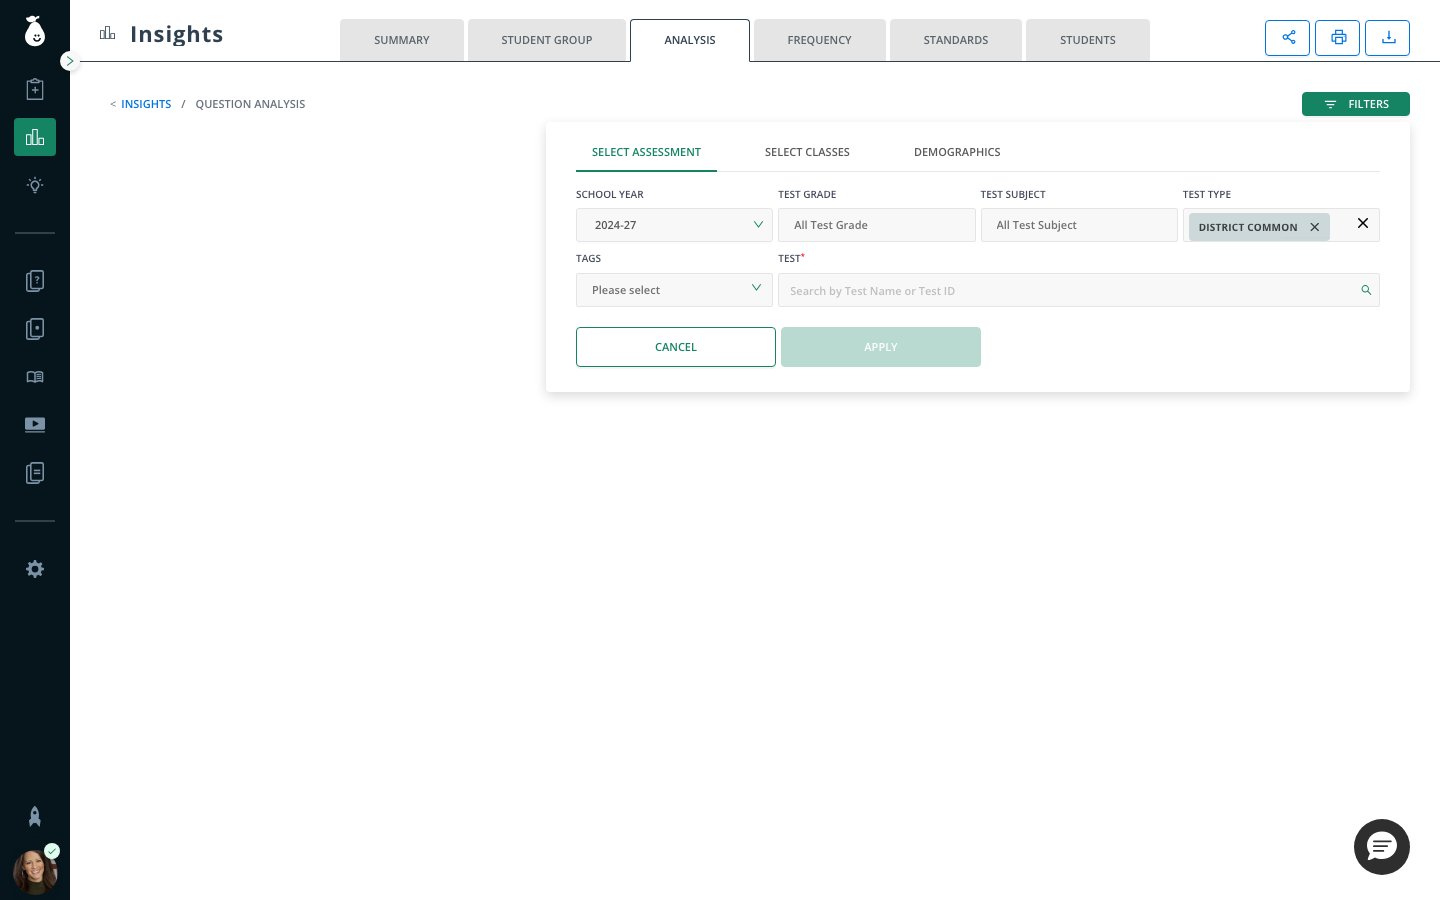 3. Select the relevant filters to narrow your reporting scope.
4. Review average scores per question. You can sort by performance or by question number using the controls below the filters.
5. Review performance analysis by school. Use the sub-filter above the table to compare by school, teacher, or class.
The color coding in **Question Analysis** uses a heat-map format and is not tied to your district's performance band definitions.
3. Select the relevant filters to narrow your reporting scope.
4. Review average scores per question. You can sort by performance or by question number using the controls below the filters.
5. Review performance analysis by school. Use the sub-filter above the table to compare by school, teacher, or class.
The color coding in **Question Analysis** uses a heat-map format and is not tied to your district's performance band definitions.