> ## Documentation Index
> Fetch the complete documentation index at: https://docs.goguardian.com/llms.txt
> Use this file to discover all available pages before exploring further.
# Whole Learner with Data Studio
> View a complete picture of an individual student's attendance and academic performance across assessments in Data Studio.
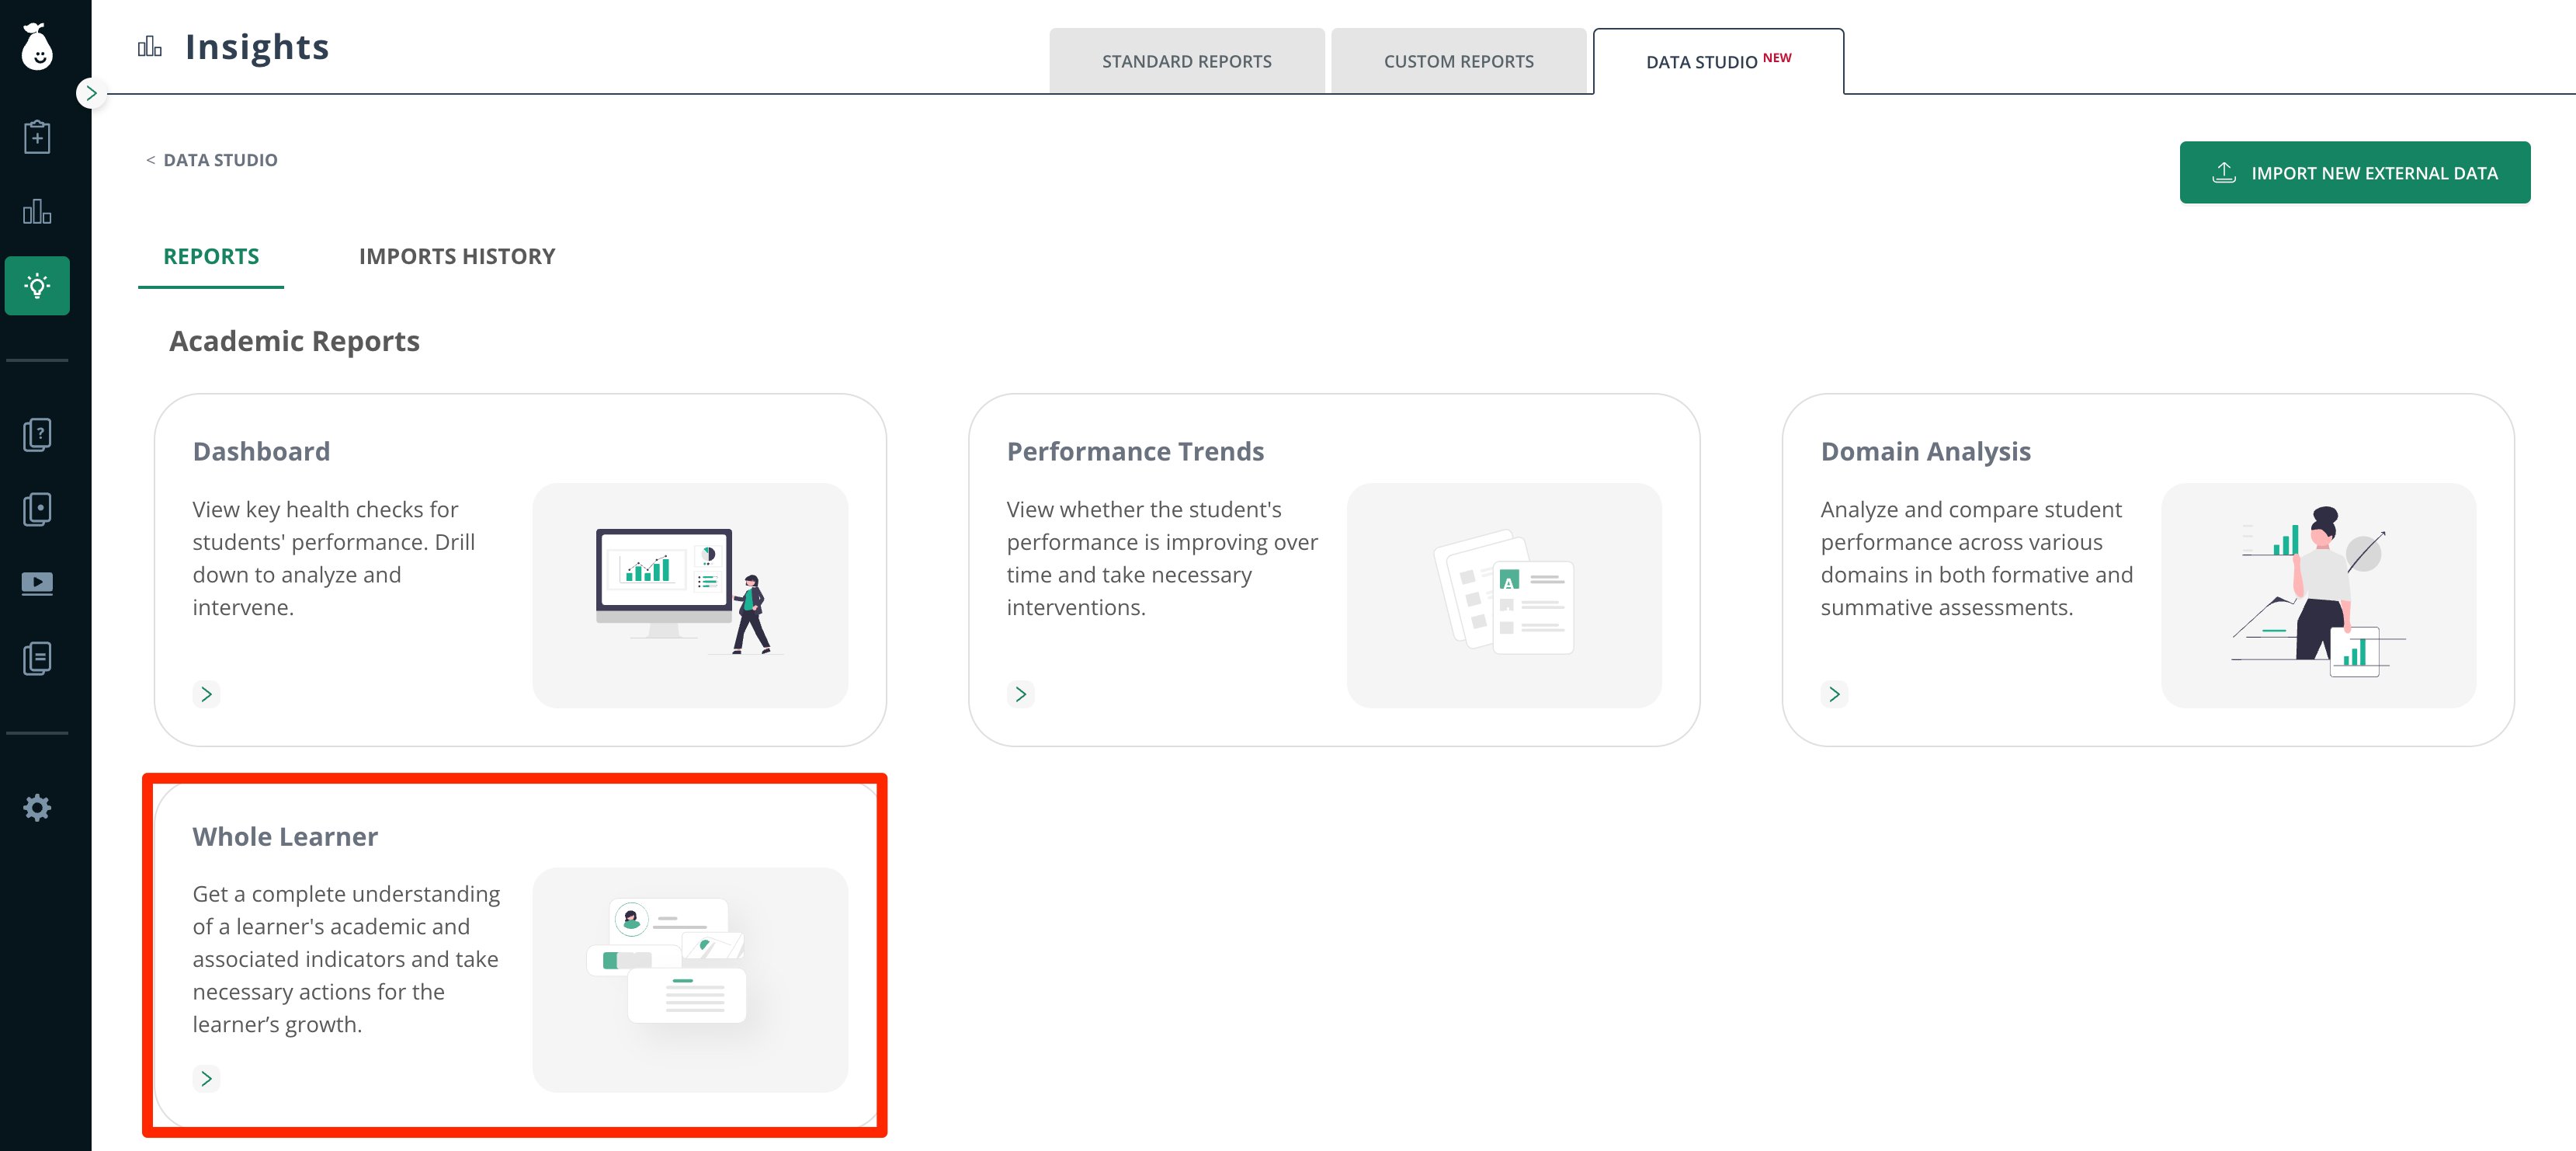
The Whole Learner report in Pear Assessment Data Studio shows a complete view of an individual student's attendance and academic progress across multiple assessments. It surfaces relevant risk indicators so you can give the essential intervention for improvement, and interventions are also visible in the trend graphs so you can determine pre- and post-performance improvement. Use it to identify where a student needs support and evaluate how they respond to interventions over time. This is an enterprise report available to administrators and teachers.
## Explore the Whole Learner Report
### View Student Profile
The top of the report displays the student's name, grade, school, and demographic information, including race, gender, IEP status, and other relevant attributes.
### Review Performance Summary Across Assessments
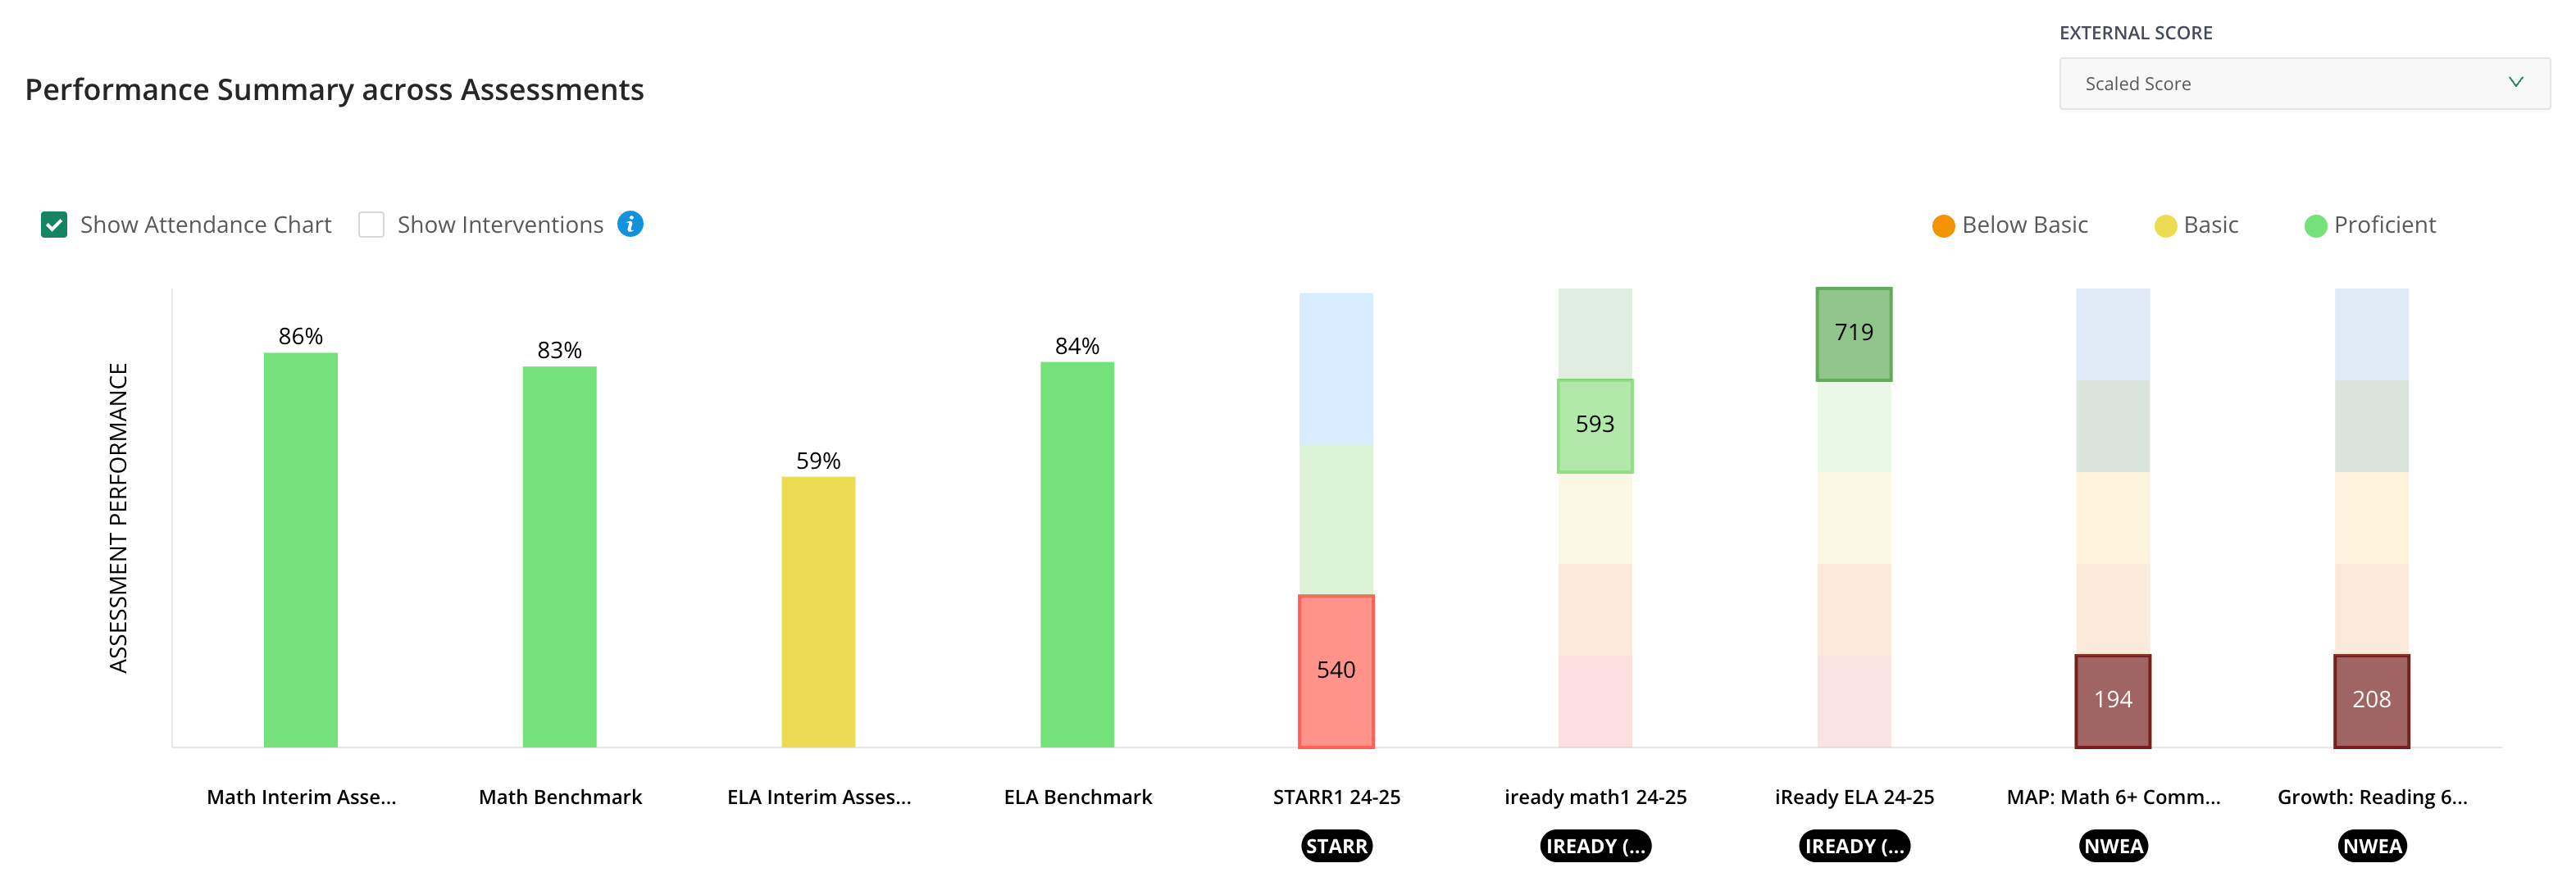
This section displays student performance across assessments in chronological order based on each assessment's start date. Bar height represents the score percentage, and bar color represents the performance band. The Performance Band filter can only be used for internal assessments to change the performance band.
Hover over any bar to see the date, score, and performance band. For external assessments, the hover view also shows all performance bands for that test, with the achieved band highlighted. External assessment bars include tags below the assessment name to indicate the test type.
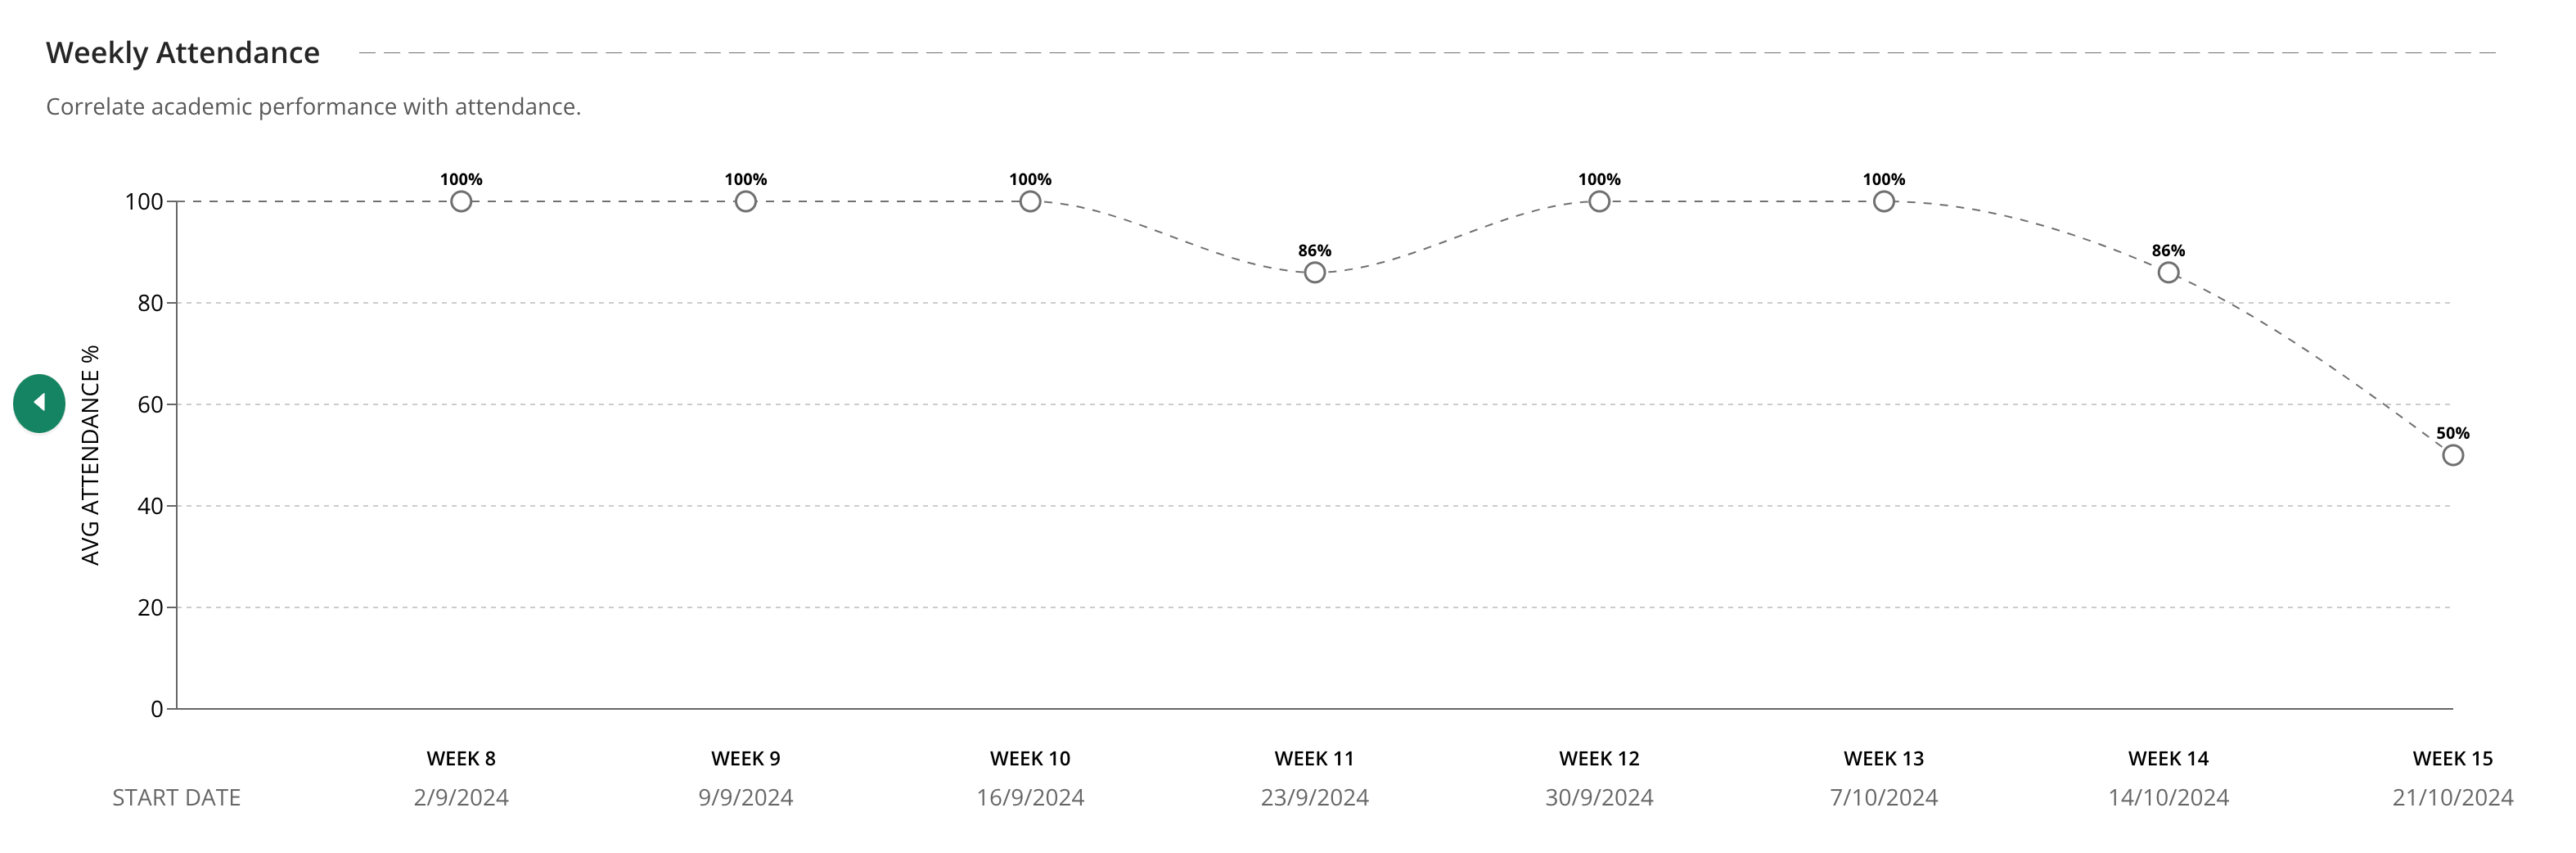
To view attendance data alongside academic performance, select **Show Attendance Chart** within this section. Users with Data Operations permissions can upload attendance data into the platform using the data-upload tool.
### Examine the Performance Deep-Dive Across Assessments
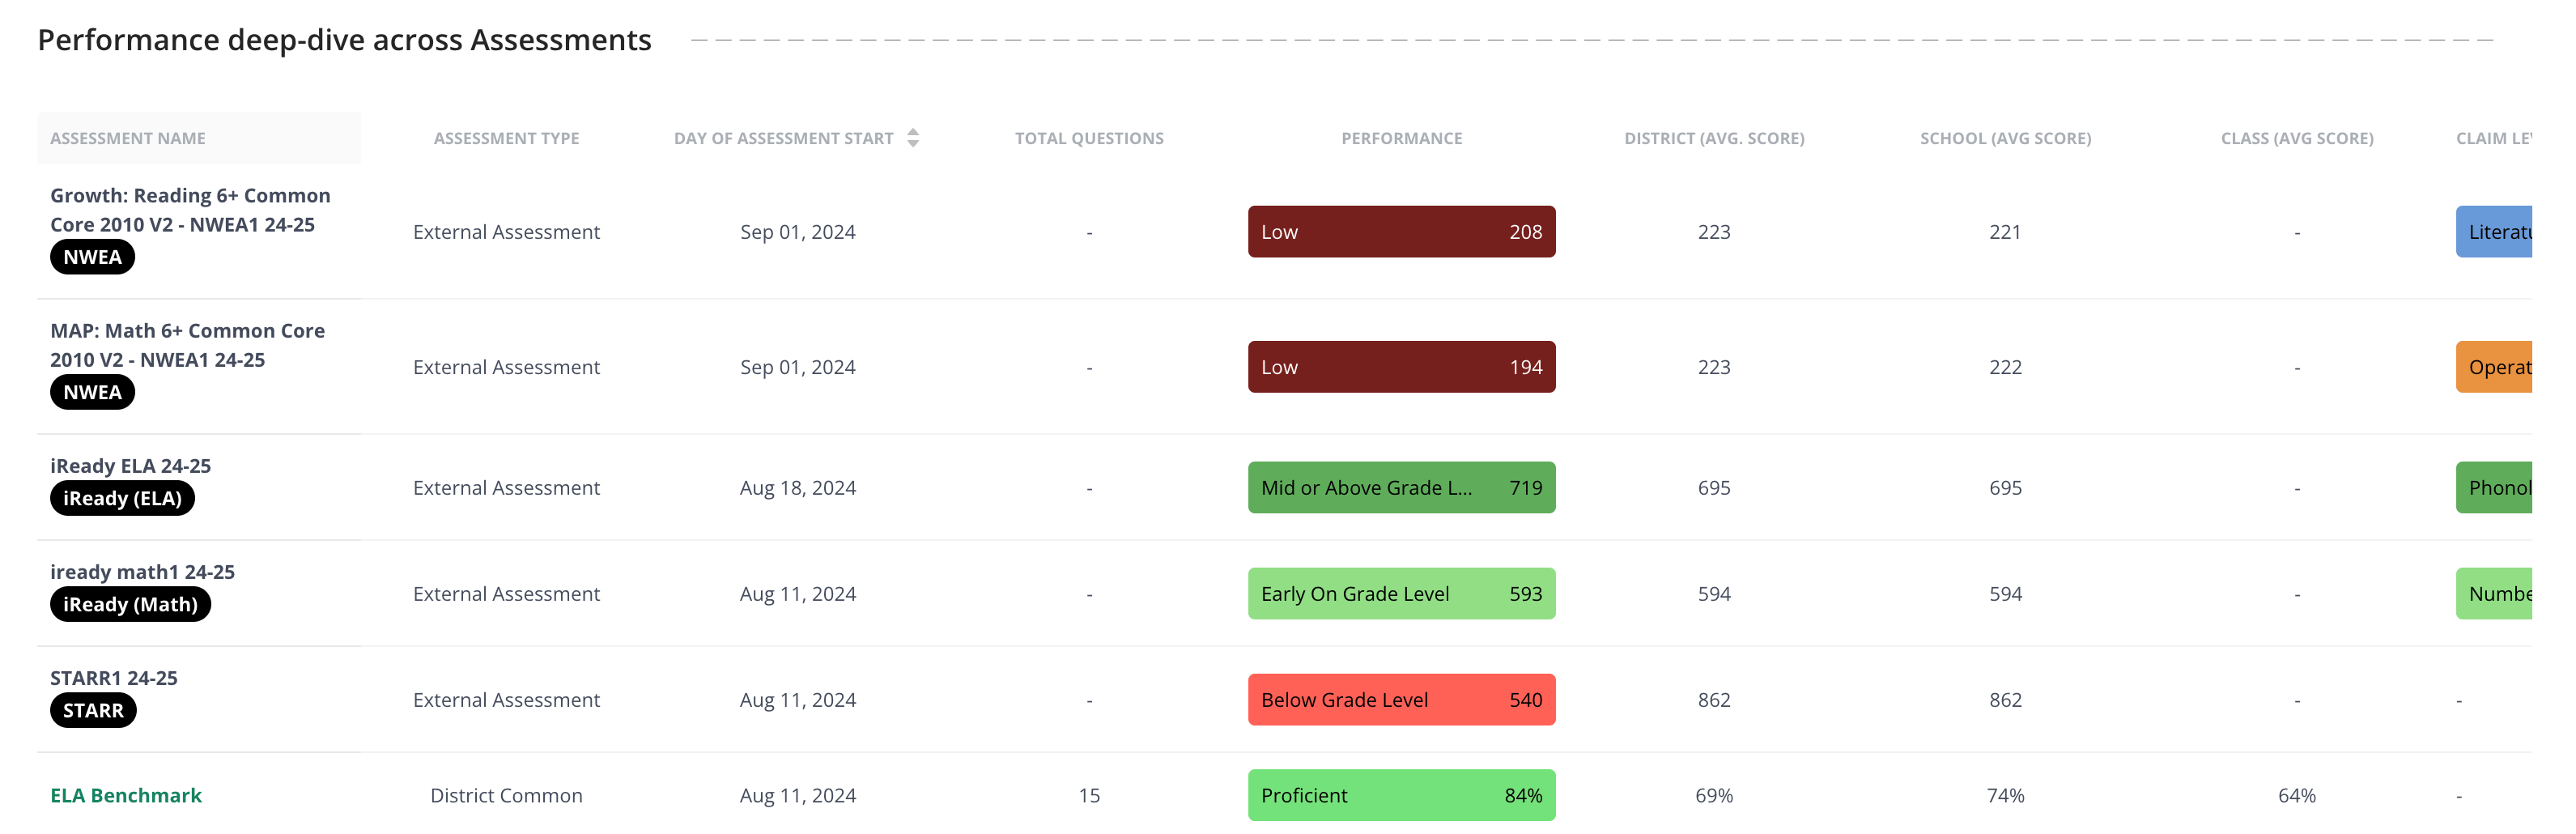
This table provides detailed assessment data for the selected student, including:
* Assessment name
* Type
* Date
* Total questions
* Performance
* Average score at the district, school, and class level
* Claim level
Claim level data relates to external assessments such as CAASPP, iReady, and NWEA. Users with a Data Operations role must upload this data before it appears in the report.

 ## Frequently Asked Questions
### What Is Claim Level Data and Where Does It Come From?
Claim level data relates to external assessments such as CAASPP, iReady, and NWEA. Users with a Data Operations role must upload this data before it appears in the report.
### How Do I View Attendance Alongside Academic Performance?
Select **Show Attendance Chart** within the Performance Summary Across Assessments section. To add attendance data, a user with Data Operations permissions must upload it using the data-upload tool.
## Resources
* [Attendance Summary with Data Studio](/products/pear-assessment/attendance-summary-with-data-studio)
* [Performance Trends with Data Studio](/products/pear-assessment/performance-trends-with-data-studio)
* [Goals and Interventions with Data Studio](/products/pear-assessment/goals-and-interventions-with-data-studio)
## Frequently Asked Questions
### What Is Claim Level Data and Where Does It Come From?
Claim level data relates to external assessments such as CAASPP, iReady, and NWEA. Users with a Data Operations role must upload this data before it appears in the report.
### How Do I View Attendance Alongside Academic Performance?
Select **Show Attendance Chart** within the Performance Summary Across Assessments section. To add attendance data, a user with Data Operations permissions must upload it using the data-upload tool.
## Resources
* [Attendance Summary with Data Studio](/products/pear-assessment/attendance-summary-with-data-studio)
* [Performance Trends with Data Studio](/products/pear-assessment/performance-trends-with-data-studio)
* [Goals and Interventions with Data Studio](/products/pear-assessment/goals-and-interventions-with-data-studio)