> ## Documentation Index
> Fetch the complete documentation index at: https://docs.goguardian.com/llms.txt
> Use this file to discover all available pages before exploring further.
# Use Classroom Climate Data
> View and act on student mood and lesson feedback data captured through Classroom Climate during and after sessions
When you activate Classroom Climate, Pear Deck adds a layer of student wellbeing information to every session: mood check-ins at the start of class and lesson feedback at the end. This article explains how to read that data in real time, review it after class, and use mood and feedback together to identify patterns across students.
## Use Mood Data in Class
When you start presenting a Pear Deck lesson, students join your session as usual. If you have turned on Classroom Climate in your [Settings](https://app.peardeck.com/home/settings), Pear Deck displays a quick prompt on the Student View asking students to indicate their mood before the lesson begins.
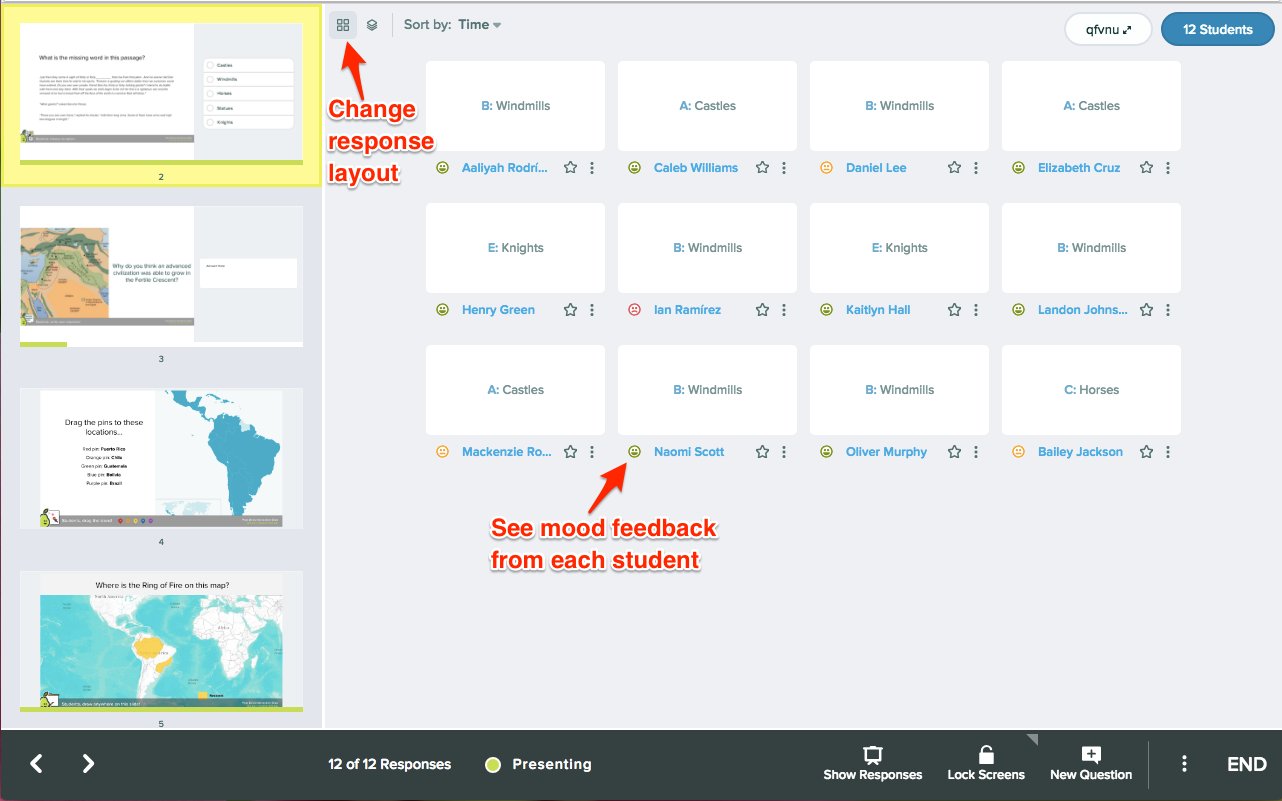
 As the teacher, you can see responses to this prompt in the private [Teacher Dashboard](/products/pear-deck/teacher-dashboard) (a Premium feature). Use the layout toggle in the top left corner of the dashboard to adjust how responses are displayed.
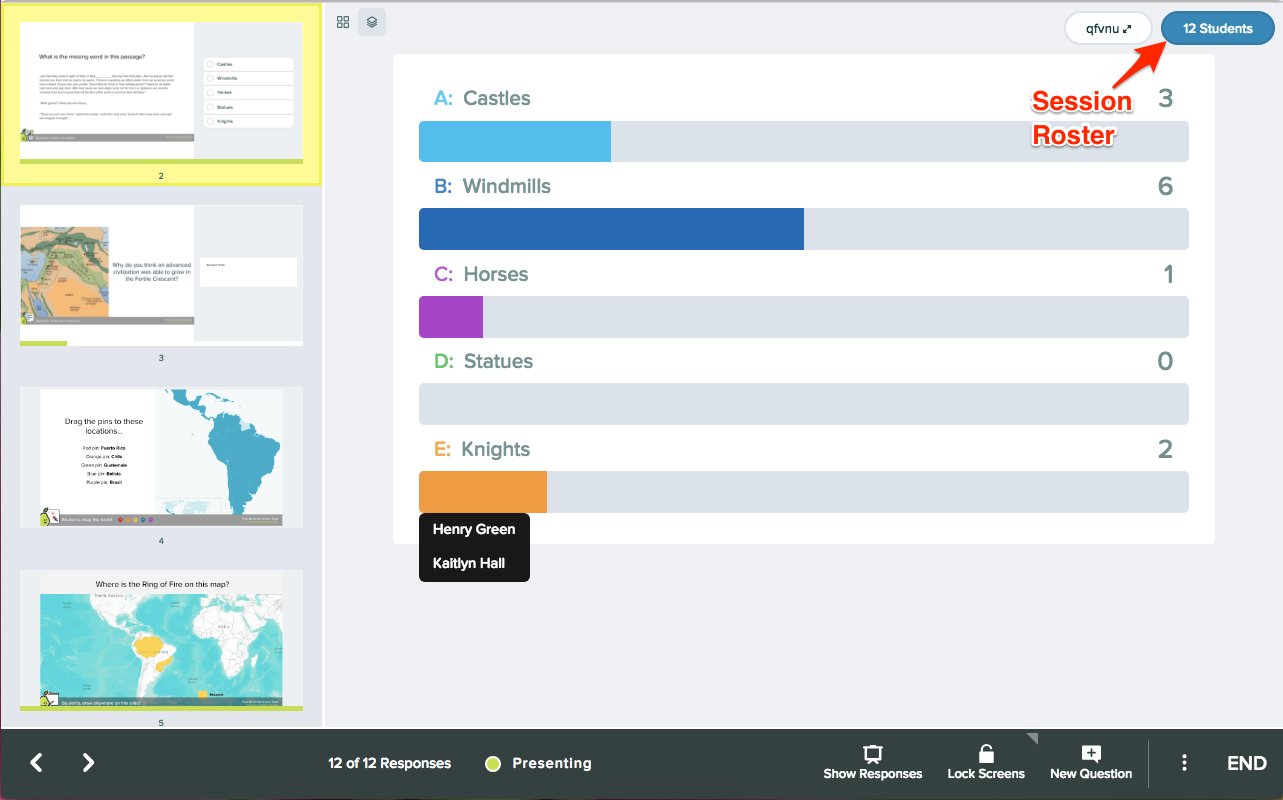
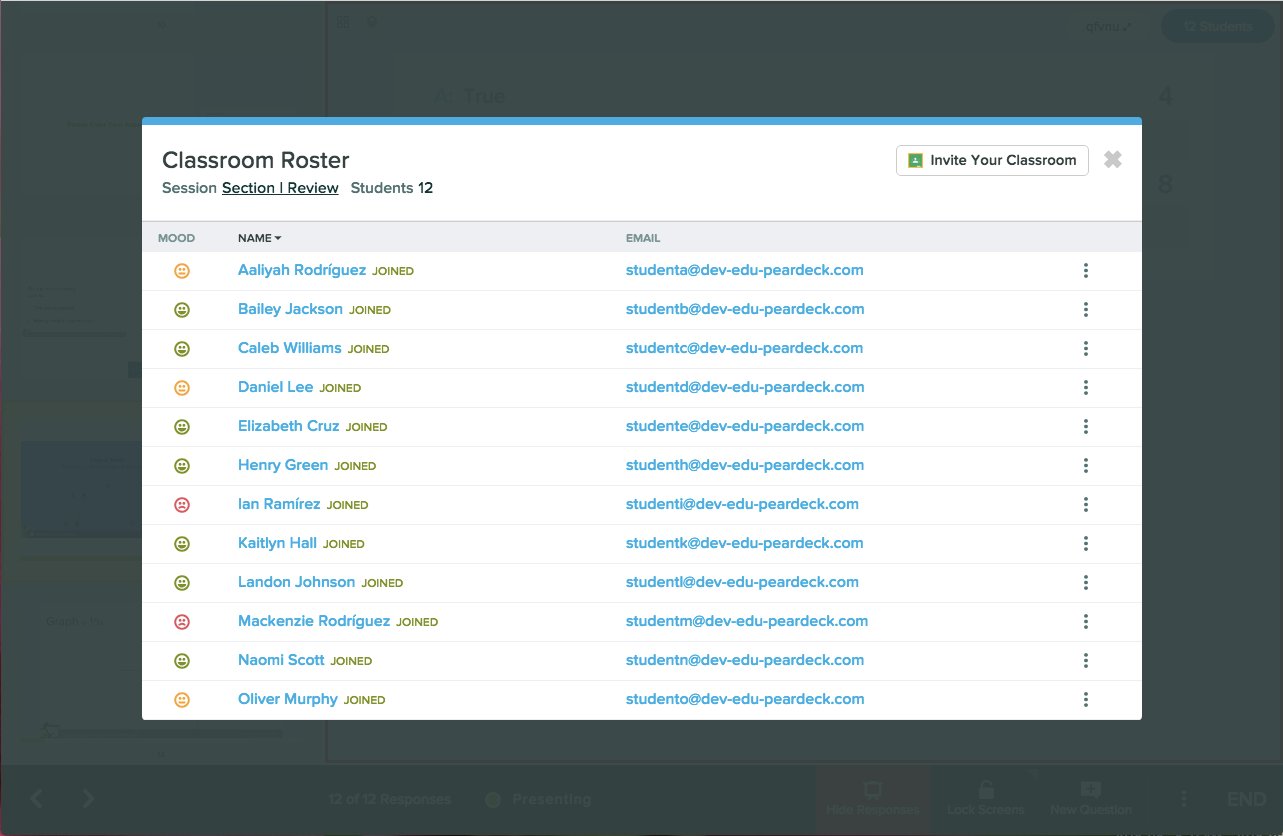
 Click **Roster** in the Dashboard to see which students have joined your session and view a heat map of how the class is feeling.
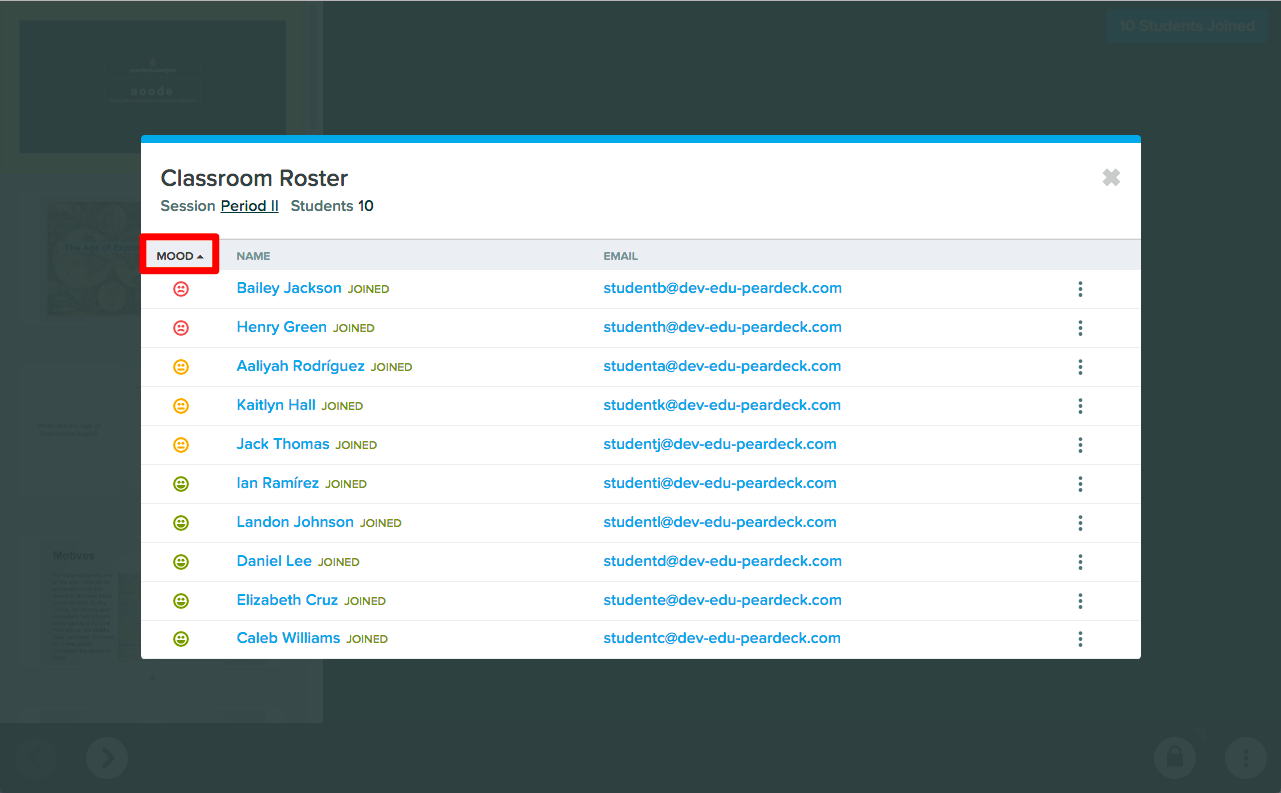
 To sort students by mood and quickly identify who may need support, click **Mood** in the roster column header.
 ### Respond to Mood Data
Here are ways mood data might shape what you do next in the lesson.
* **Most students report a positive mood, with a few reporting a negative mood.** Continue the lesson as planned, but be attentive to those students. Avoid putting them on the spot or calling on them unexpectedly.
* **A high percentage of students report a negative mood.** Consider pausing the lesson. If students are not in a receptive state, pressing ahead may be less effective than checking in with the group first.
* **You want to understand more about what students are feeling.** Hover over the bottom of any slide to open the Navigation Bar, then click **New Prompt**. Choose a Text Question type and ask students verbally to explain their mood selection. Their responses may reveal something affecting the broader class: fatigue, stress, or a situation that calls for a shift in tone or pacing.
## Review Lesson Feedback Data After Class
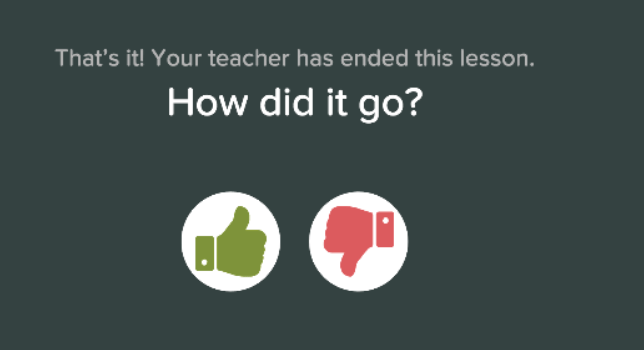
When you are ready to end the class, click **END** in the session controls. Pear Deck then displays a "How did it go?" prompt on the Student View, where students select a thumbs up or thumbs down. Students have one hour to respond before the poll closes.
This data gives you a quick read on whether students felt engaged by the lesson. The question is intentionally broad so it works across all class types. You can give students a more specific prompt verbally, for example, "Did you think this lesson was engaging?" or "Do you feel like you learned something?" Use the aggregate results to identify your most effective lessons and revisit them.
To find lesson feedback data after class:
1. Open your [Pear Deck Home](https://app.peardeck.com/home/) screen.
2. Go to the **Present a File** section, or navigate directly to [Sessions](https://app.peardeck.com/home/sessions).
3. Click a deck title to see all sessions associated with that file.
4. Click either the student attendance number or the thumbs up rating to open the roster and view Classroom Climate data.
### Respond to Mood Data
Here are ways mood data might shape what you do next in the lesson.
* **Most students report a positive mood, with a few reporting a negative mood.** Continue the lesson as planned, but be attentive to those students. Avoid putting them on the spot or calling on them unexpectedly.
* **A high percentage of students report a negative mood.** Consider pausing the lesson. If students are not in a receptive state, pressing ahead may be less effective than checking in with the group first.
* **You want to understand more about what students are feeling.** Hover over the bottom of any slide to open the Navigation Bar, then click **New Prompt**. Choose a Text Question type and ask students verbally to explain their mood selection. Their responses may reveal something affecting the broader class: fatigue, stress, or a situation that calls for a shift in tone or pacing.
## Review Lesson Feedback Data After Class
When you are ready to end the class, click **END** in the session controls. Pear Deck then displays a "How did it go?" prompt on the Student View, where students select a thumbs up or thumbs down. Students have one hour to respond before the poll closes.
This data gives you a quick read on whether students felt engaged by the lesson. The question is intentionally broad so it works across all class types. You can give students a more specific prompt verbally, for example, "Did you think this lesson was engaging?" or "Do you feel like you learned something?" Use the aggregate results to identify your most effective lessons and revisit them.
To find lesson feedback data after class:
1. Open your [Pear Deck Home](https://app.peardeck.com/home/) screen.
2. Go to the **Present a File** section, or navigate directly to [Sessions](https://app.peardeck.com/home/sessions).
3. Click a deck title to see all sessions associated with that file.
4. Click either the student attendance number or the thumbs up rating to open the roster and view Classroom Climate data.
 ## Use Mood and Lesson Feedback Data Together
When you click the student attendance number or the thumbs up percentage in the sessions list, Pear Deck displays a full report showing each student's mood check-in alongside their end-of-lesson feedback rating.
## Use Mood and Lesson Feedback Data Together
When you click the student attendance number or the thumbs up percentage in the sessions list, Pear Deck displays a full report showing each student's mood check-in alongside their end-of-lesson feedback rating.
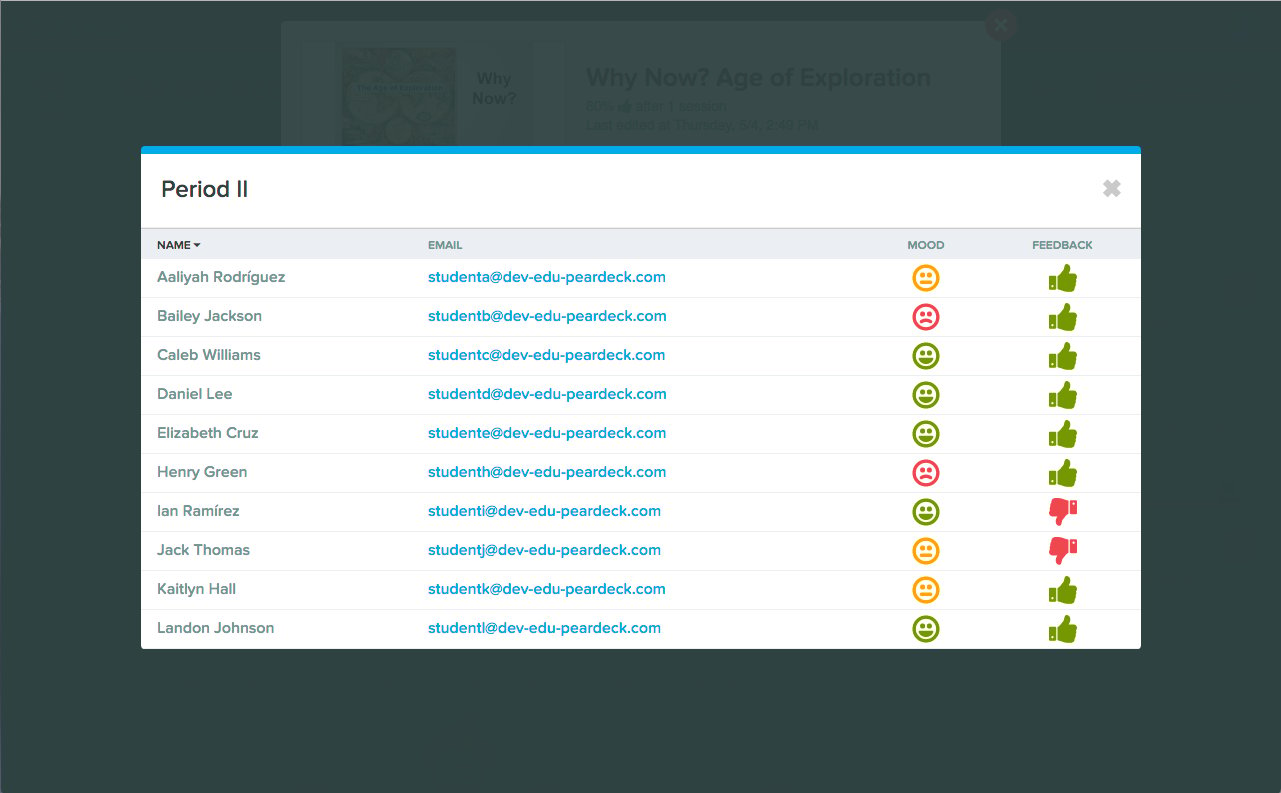 This combined view helps you identify correlations between how students felt at the start of class and how they rated the lesson.
* **Many thumbs down ratings came from students who also reported a negative mood.** This may reflect emotional state rather than lesson quality. However, if students who reported a positive mood also gave a thumbs down, the lesson itself may need revision before you use it again.
* **The same student repeatedly reports a negative mood and rates lessons with a thumbs down.** This pattern may indicate that something is preventing the student from engaging. A more direct check-in or intervention may be appropriate.
For further reading on supporting students' social and emotional wellbeing, see [Teaching Social Skills to Improve Grades and Lives](http://opinionator.blogs.nytimes.com/2015/07/24/building-social-skills-to-do-well-in-math/) by David Bornstein.
## Resources
Navigate the Teacher Dashboard to monitor student responses and control your session in real time.
Turn on Classroom Climate in your Pear Deck settings to start collecting mood and feedback data.
This combined view helps you identify correlations between how students felt at the start of class and how they rated the lesson.
* **Many thumbs down ratings came from students who also reported a negative mood.** This may reflect emotional state rather than lesson quality. However, if students who reported a positive mood also gave a thumbs down, the lesson itself may need revision before you use it again.
* **The same student repeatedly reports a negative mood and rates lessons with a thumbs down.** This pattern may indicate that something is preventing the student from engaging. A more direct check-in or intervention may be appropriate.
For further reading on supporting students' social and emotional wellbeing, see [Teaching Social Skills to Improve Grades and Lives](http://opinionator.blogs.nytimes.com/2015/07/24/building-social-skills-to-do-well-in-math/) by David Bornstein.
## Resources
Navigate the Teacher Dashboard to monitor student responses and control your session in real time.
Turn on Classroom Climate in your Pear Deck settings to start collecting mood and feedback data.