Compare attendance trends across schools, teachers, and student cohorts, and identify students who may be at risk of chronic absenteeism in Data Studio.
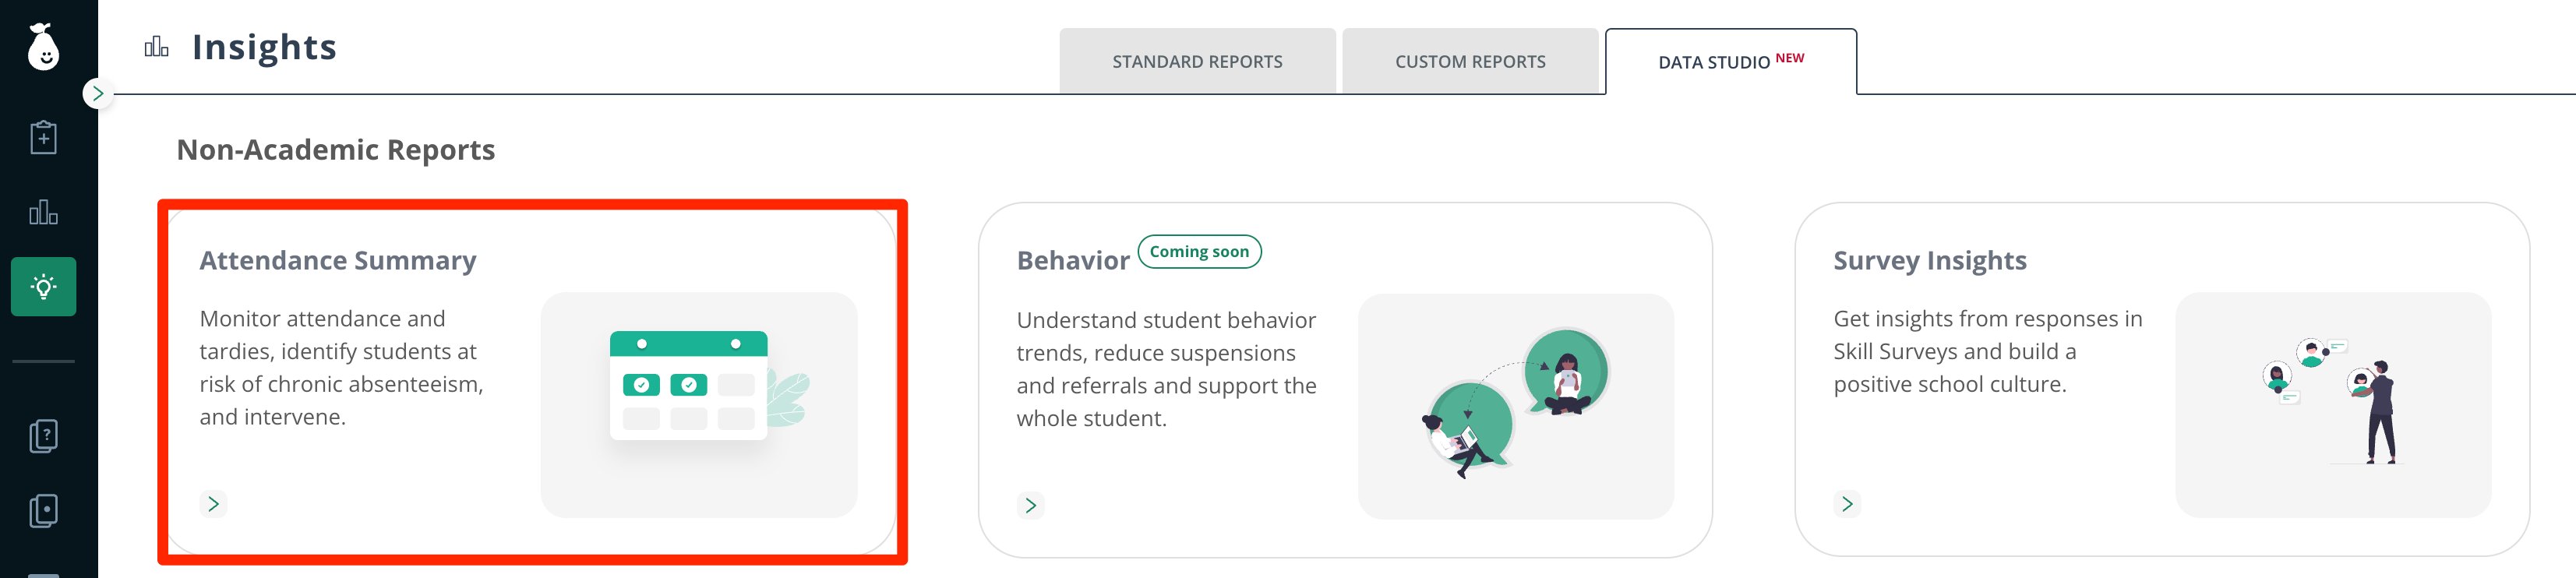
The Attendance Summary report in Pear Assessment Data Studio compares attendance trends across schools, teachers, and student cohorts, and helps you identify students who may be at risk of chronic absenteeism or tardiness. Apply filters to narrow the scope of the report to your preferred view. This is an enterprise report available to administrators and teachers.
The Attendance Trends section provides attendance details over time to help identify patterns. Toggle between weekly and monthly views using the view selector. Hover over the data points to see the number of students present, absent with excuse, and tardy for each period.
Understand Attendance Distribution and Disruptions
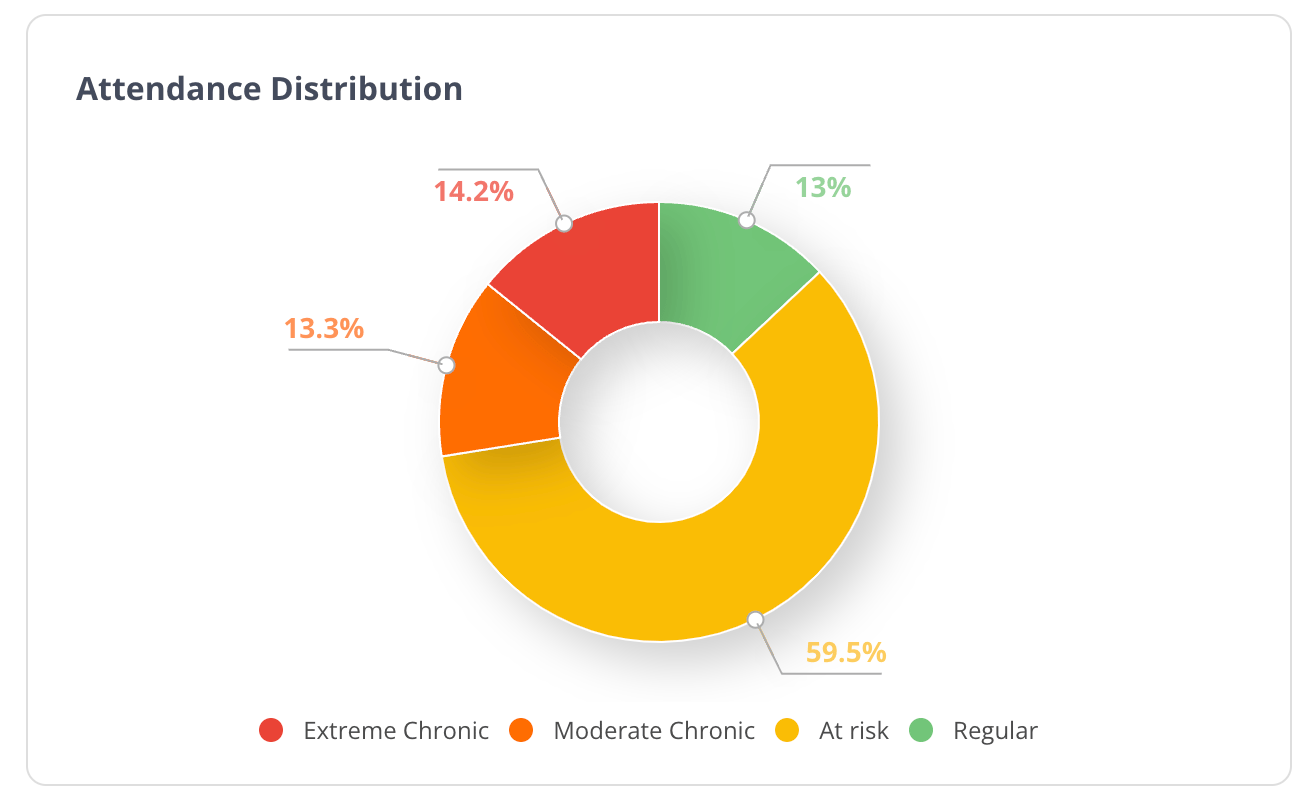
The Attendance Distribution chart shows how attendance is distributed across your district’s defined attendance bands. Districts configure their own band labels and thresholds. A common band structure includes:
Regular
At Risk
Moderate Chronic
Extreme Chronic
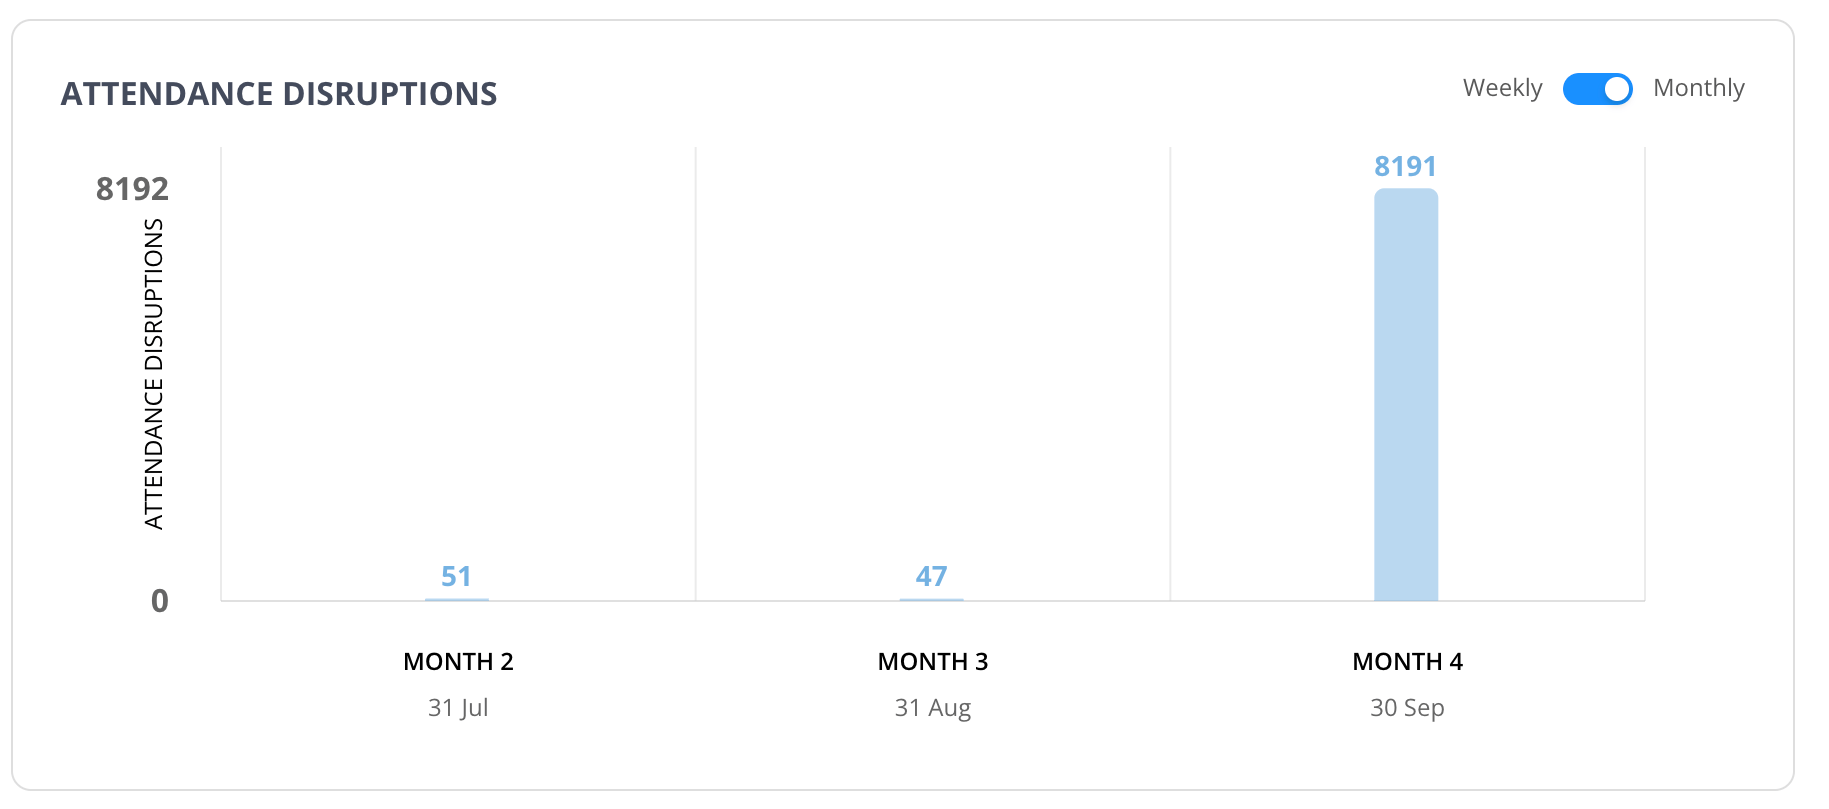
Students in the Moderate Chronic and Extreme Chronic bands may need additional support from an administrator or teacher.The Attendance Disruptions section shows the number of irregular attendance events across a week or month.
The Performance section shows non-academic attendance data across schools, including the number of students at each school, average attendance, number of disruptions, and total student count. Use the Compare By filter to view data broken down by:
What Does the Attendance Disruptions Section Show?
The Attendance Disruptions section shows the number of irregular attendance events across a week or month, helping you identify patterns that may warrant follow-up.