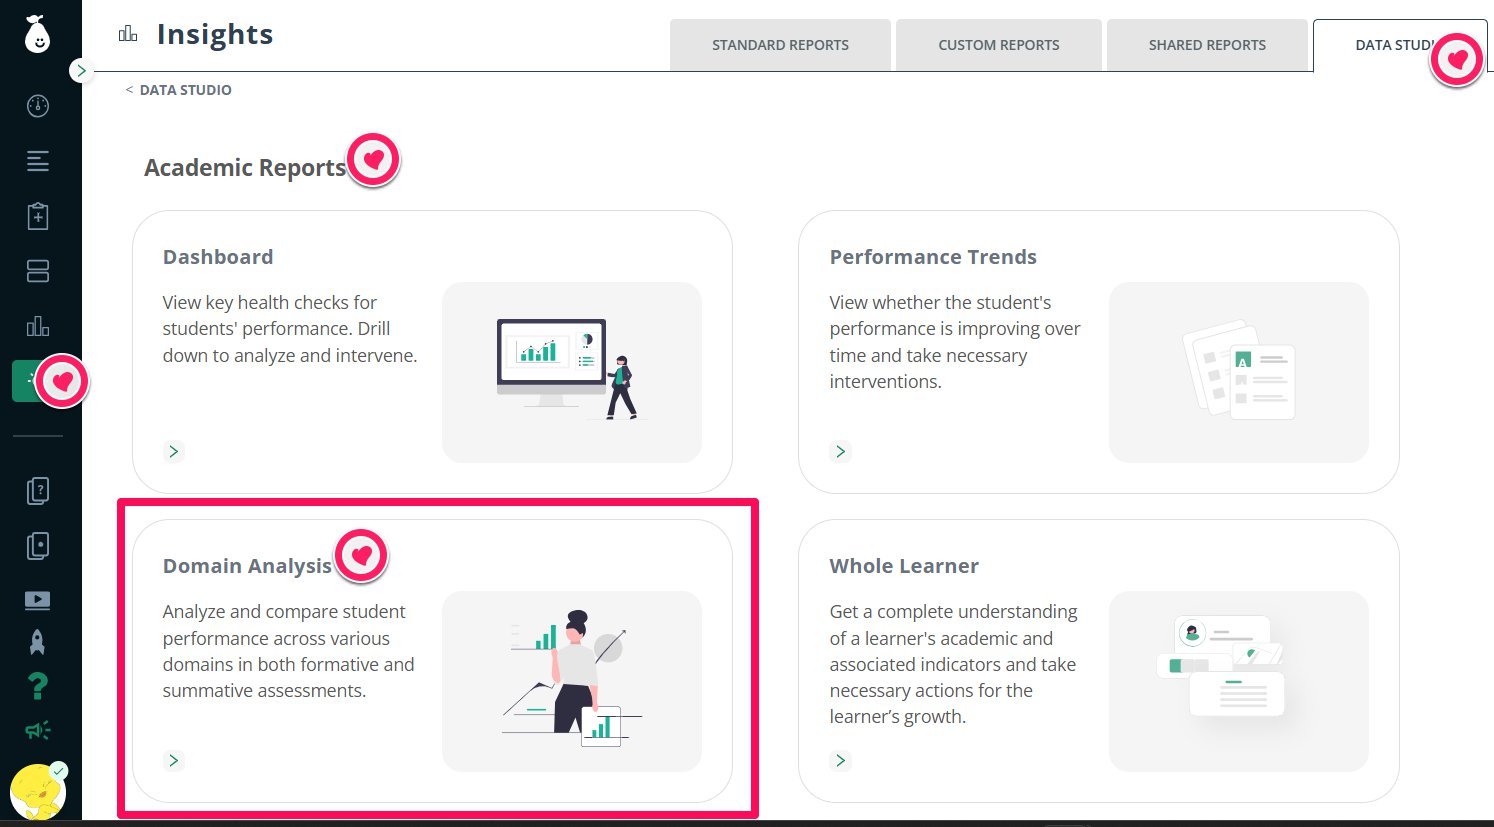
Review student performance across learning domains, clusters, and standards using Pear Assessment and imported test data in Data Studio.
The Domain Analysis report in Pear Assessment Data Studio shows how students are performing across broad learning areas (domains) and — when available — within smaller skill groups (clusters) or individual standards. Use it to identify strengths and gaps, compare performance across student groups, and guide instructional planning. This is an enterprise report available to administrators and teachers.
Domains are broad learning areas aligned to the standards you teach, grouping related skills and concepts together. Within a domain, clusters are smaller groups of related standards. Standards are the most granular level.Not all domains include cluster- or standard-level breakdowns. Cluster and standard data appear only when those mappings are available in the test content.
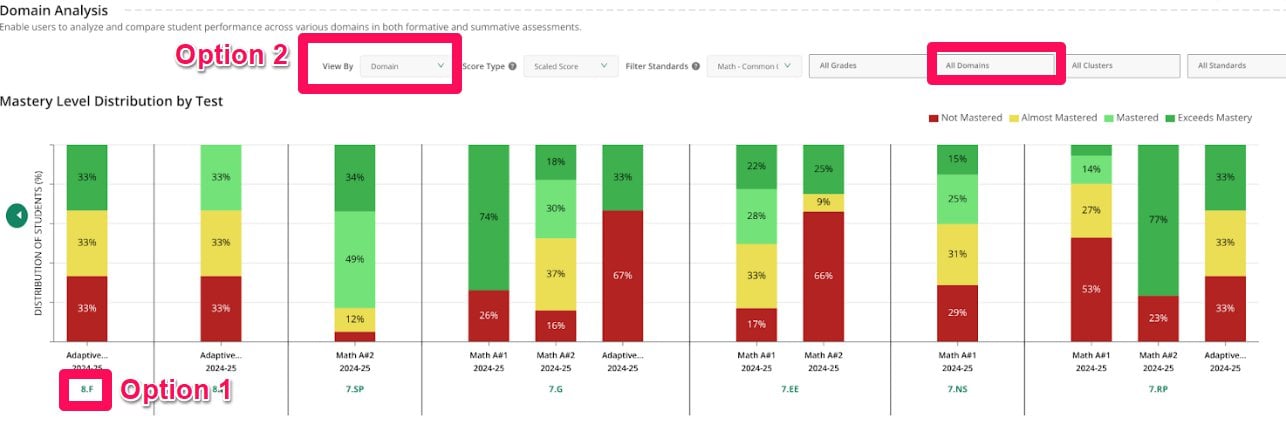
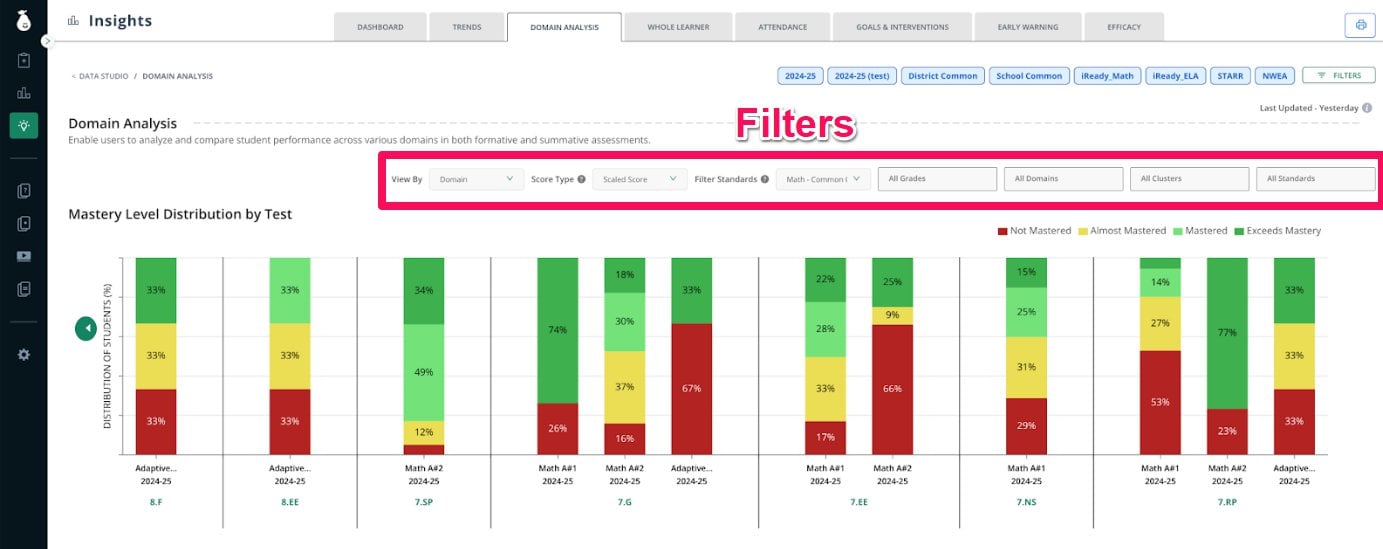
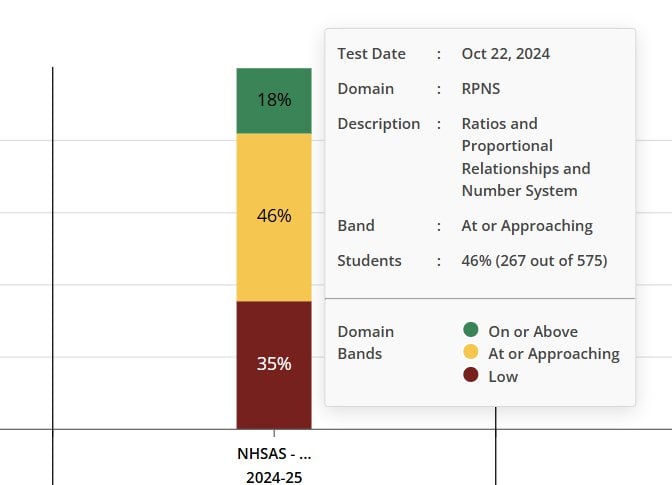
The Mastery Level Distribution by Test bar chart shows how students performed across tests, broken down by mastery level. Each bar represents a domain, cluster, or standard. Hover over a bar to see exact percentages.To explore more detailed data, you have two options:
Click a domain bar directly to drill down into clusters or standards.
Use the View By dropdown to select Cluster or Standard, then apply the domain filter at the top of the report.
This report aggregates data across multiple school years, covering both Pear Assessment tests and any external tests you have imported into the platform.
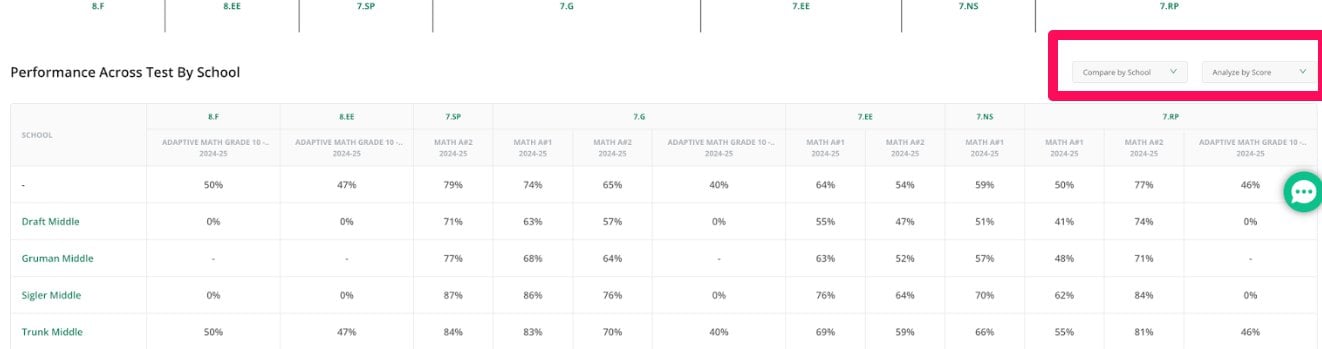
The Performance Across Test table provides a flexible view of performance data that you can compare across different groups. Use the Compare By dropdown to select a grouping — school, teacher, class, student, race, gender, or other available demographics. Use the Analyze By dropdown to view results by score or by mastery level.
Can I View Performance Across Multiple School Years?
Yes. The report aggregates data across multiple years, making it easier to identify long-term trends in student mastery across domains, clusters, and standards.