

Understand How Screen Time Is Measured
Screen Time measures web browsing while a browser tab is active and in focus. Background tabs do not accumulate Screen Time, and only 1 tab in 1 browser window can be in focus at a time. Screen Time currently has no idle-time cutoff. A focused tab can continue accumulating Screen Time while the device is idle. Closing the browser or device lid, putting the device to sleep, or losing connectivity stops new Screen Time from accumulating. Screen Time data is processed nightly. Activity from today may not appear until the following day.Filter Screen Time Insights
The default date range is Last 30 days. Use these filters to change the scope of every chart and table on the page:- Grade Levels
- Schools
- OUs
- OSes
- Classrooms
- Date
Discover hides Grade Levels when grade-level data is unavailable, such as when your organization has no supported Clever, ClassLink, or OneRoster integration in GoGuardian Org Management. Grade-level data is available for browsing activity collected on or after August 31, 2026.
Review Screen Time Trends
The Screen Time Trends chart displays average daily active Screen Time per unique user. Its primary value is labeled Per User per Day. The chart separates the average into:- In School
- Out of School
- Undetermined
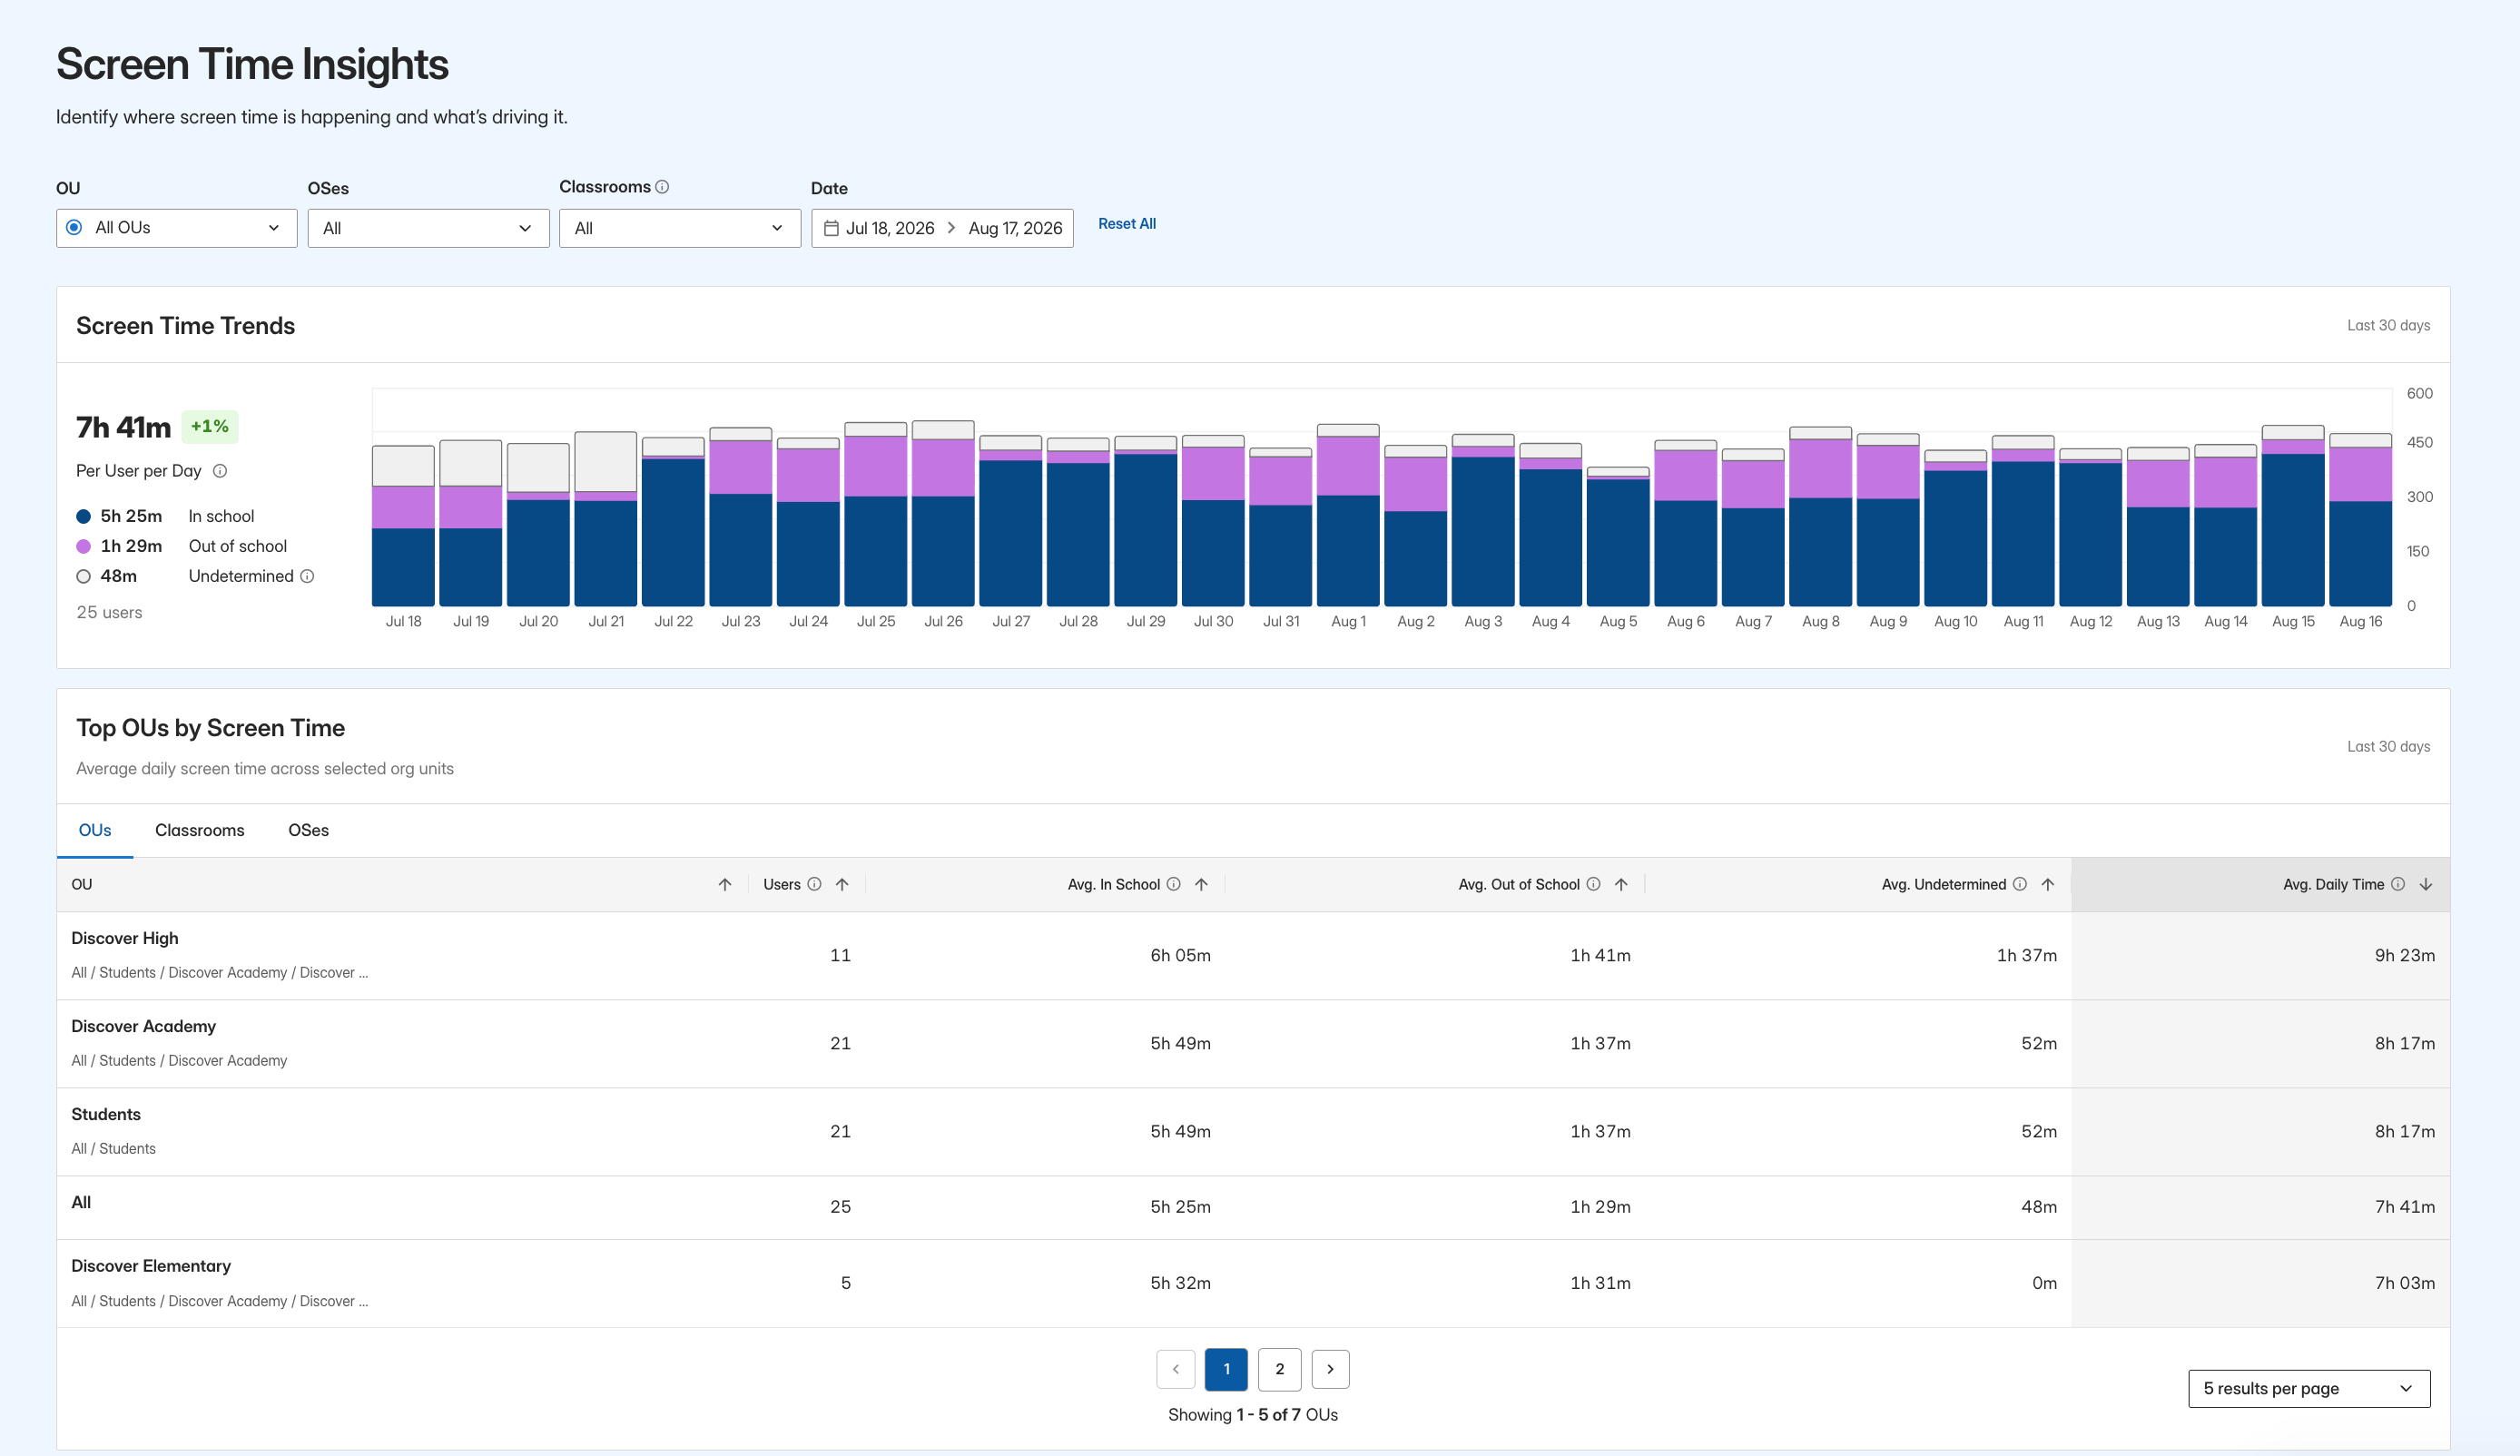
The Per User per Day tooltip reads: “Average daily active screen time per user across all browsing activity during the selected date range, including websites and apps not currently tracked in Discover. When available, active screen time is separated into in-school and out-of-school activity.”
Interpret School Context
Discover assigns each browsing activity 1 of these categories when the activity is processed:
The category is fixed when the activity is processed. Later changes to In School Hours or School IP Ranges do not reclassify historical activity.
Browsing can be Undetermined when it was collected by an older version of The GoGuardian App or extension, when a temporary network or processing issue prevented classification, or when the organization did not have the required school information configured.
The Undetermined tooltip reads: “Screen time that couldn’t be determined to be in school or out of school because the required information wasn’t available.”
See Configure At Home Mode for information about In School Hours and School IP Ranges.
Compare Screen Time by Group
Top OUs by Screen Time displays average daily Screen Time by organizational unit. Select the OUs, Classrooms, or OSes tab to change the grouping, table heading, and first column. The table includes:- Users
- Avg. In School
- Avg. Out of School
- Avg. Undetermined
- Avg. Daily Time
Review Apps, Categories, and Approval Status
The lower section of Screen Time Insights includes:- Top Categories by % of Total Screen Time
- Screen Time by App Approval Status
- Top Apps by Screen Time
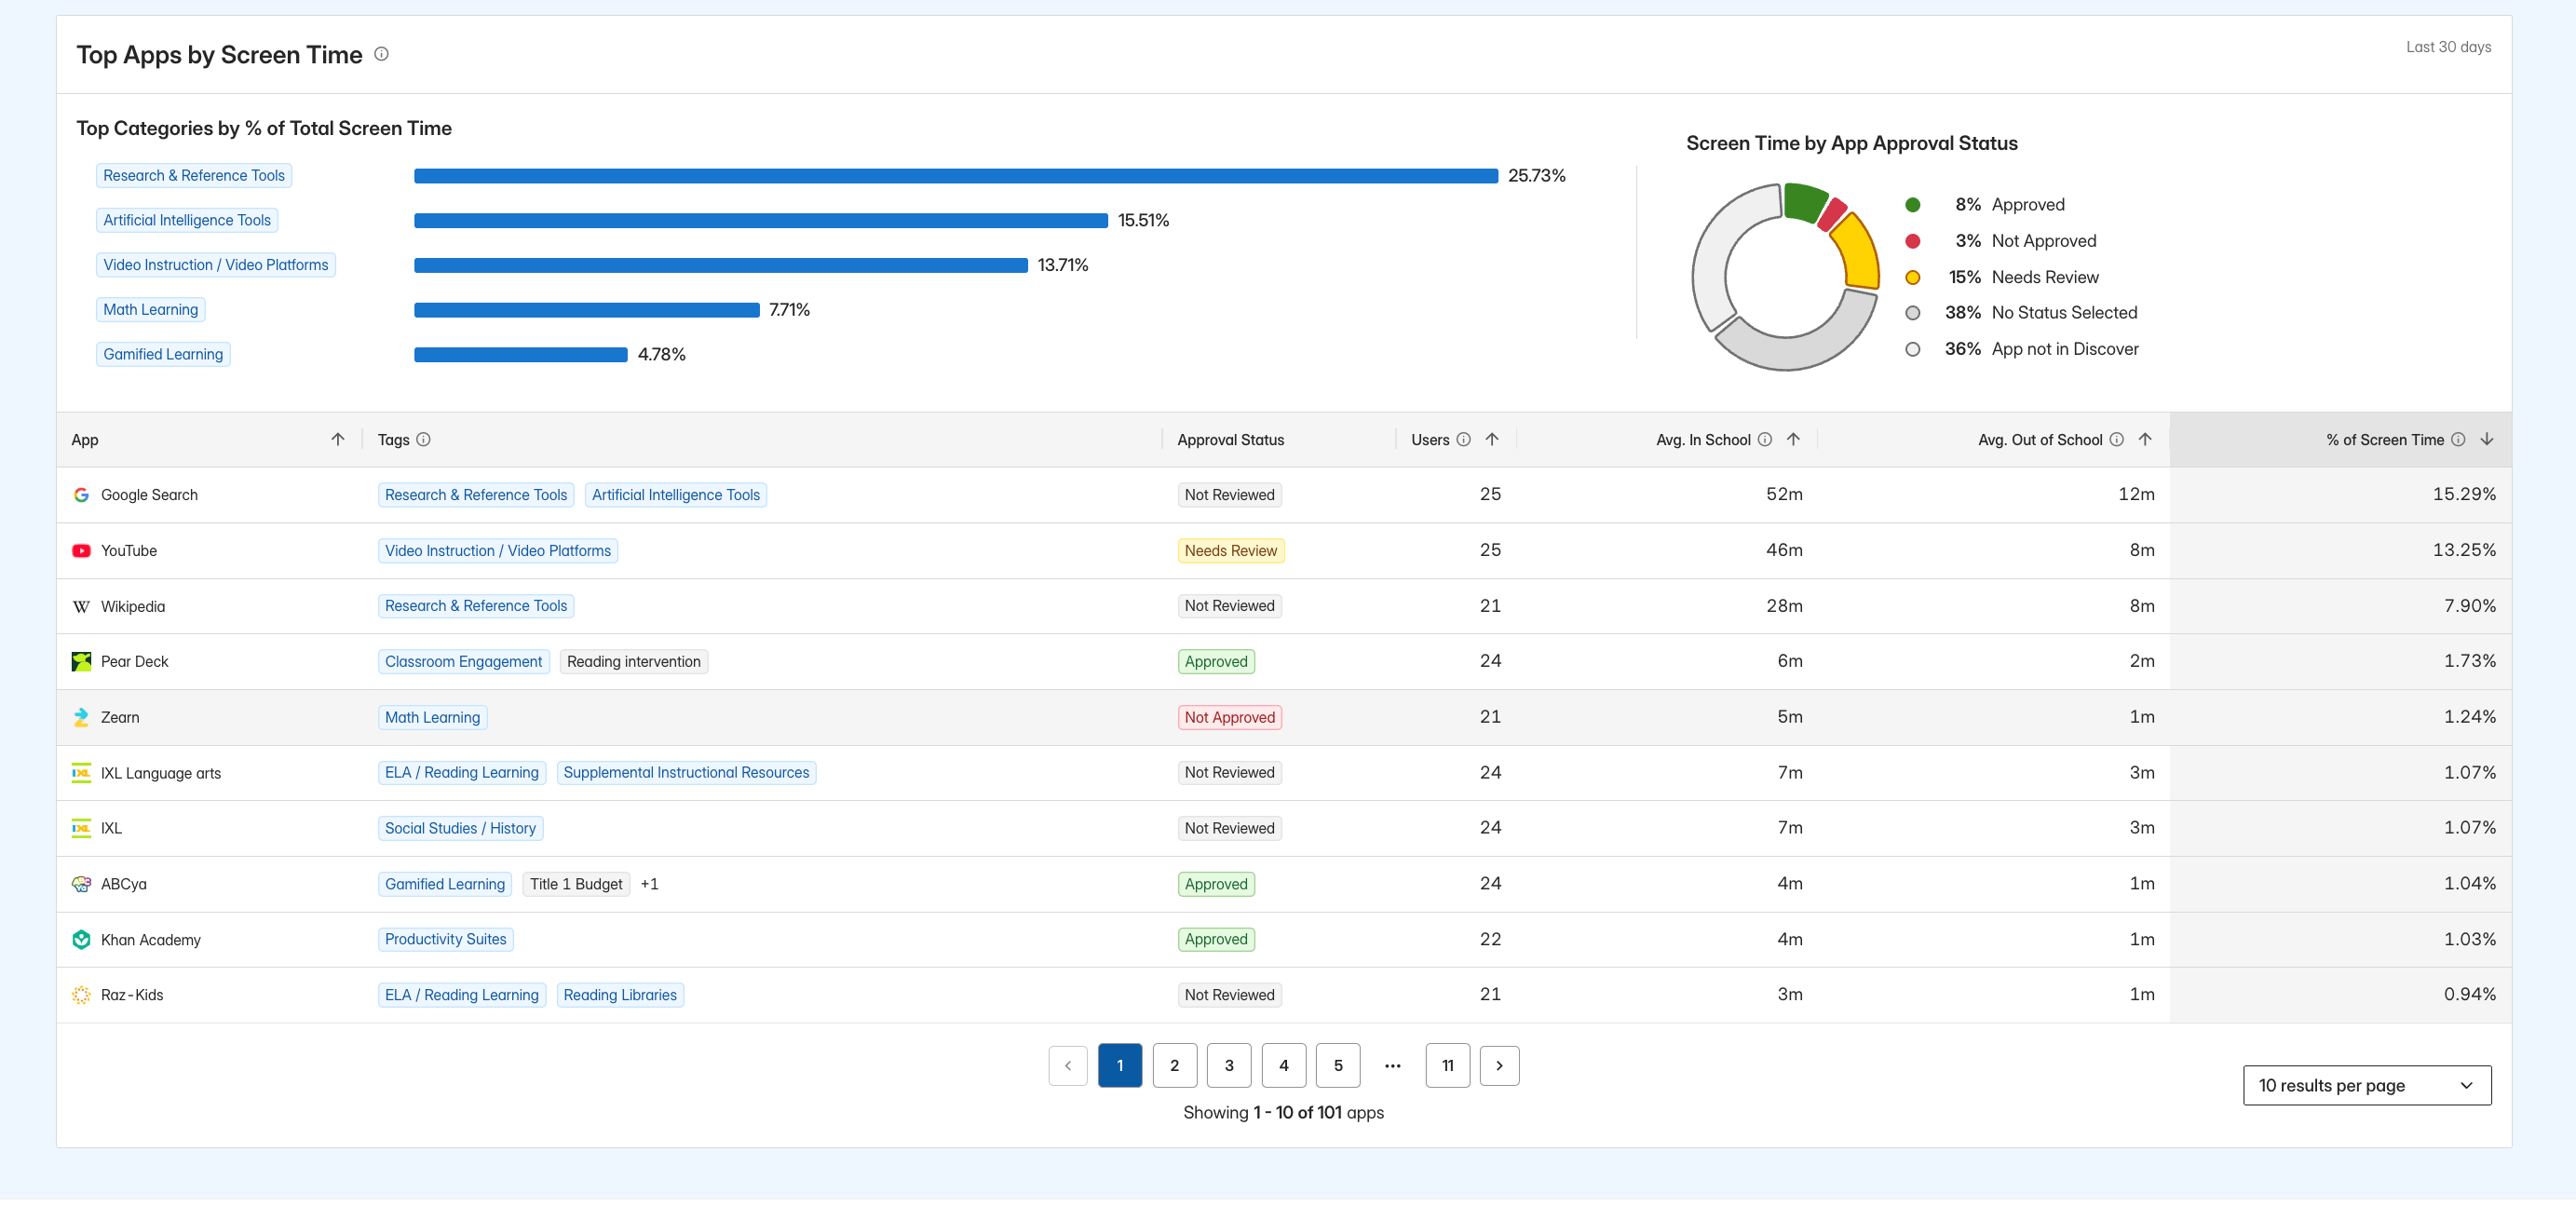
- App
- Tags
- Approval Status
- Users
- Avg. In School
- Avg. Out of School
- % of Screen Time
Resolve Missing Screen Time Data
When no activity matches the selected scope, each affected chart or table displays:No Screen Time Data Found. Try adjusting filters or timeframe to view screen time activity.Change or reset the filters and confirm that the selected date range includes processed activity.