

What You Can Do in Question Analysis
- Compare the score (%) and time spent by students per question
- View standards and points associated with a question
- Compare average performance between classes on an individual question
- Preview any question by clicking on it
- Filter results by test, class, performance, and demographic
Review the Question Analysis Report
- In Pear Assessment, click Insights in the navigation menu.
- Click Question Analysis under Single Assessment Report.
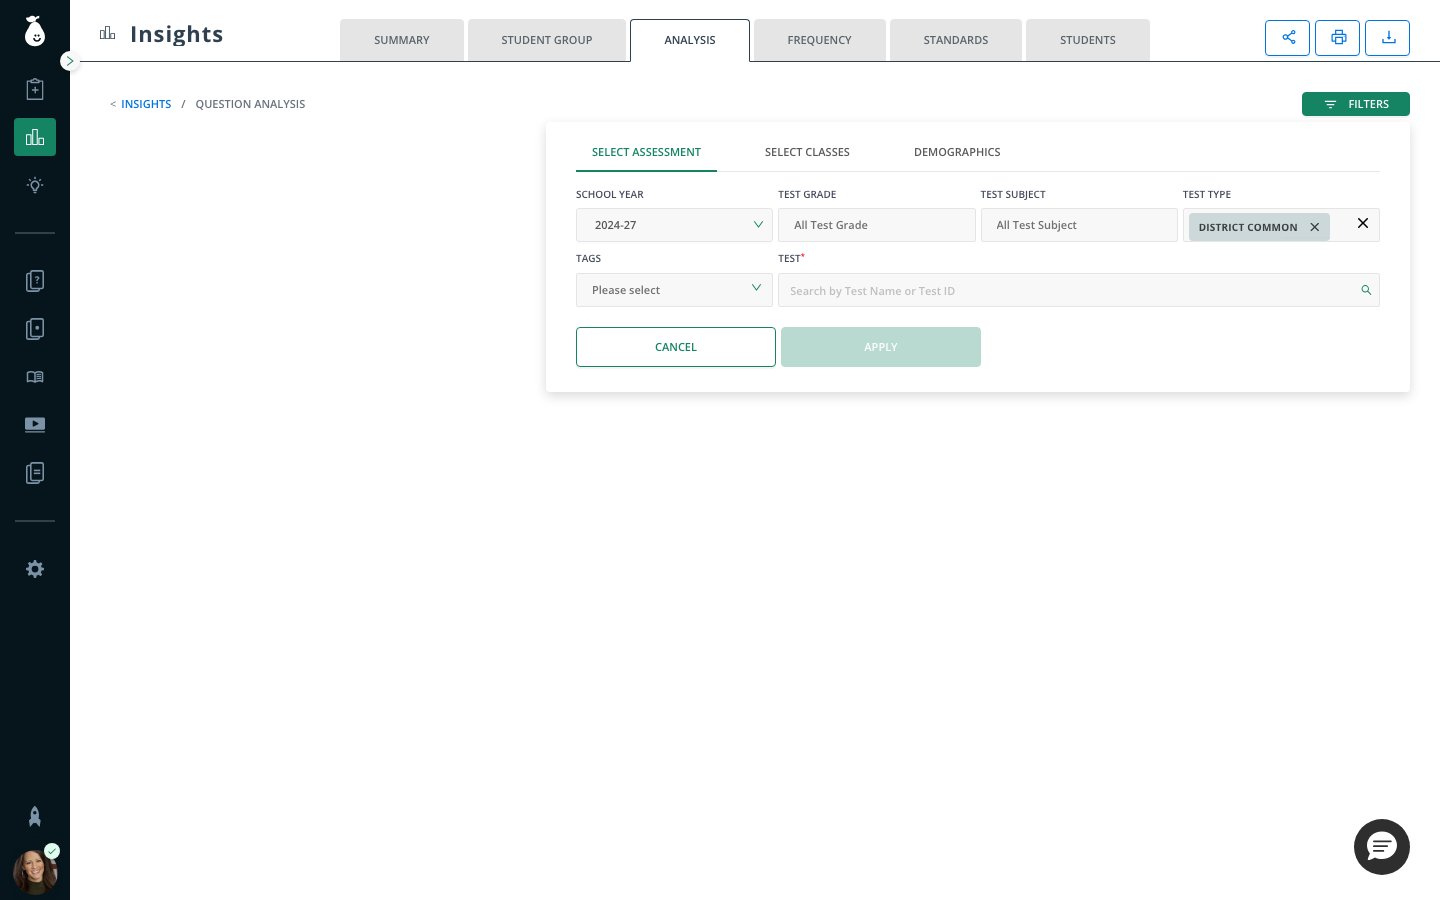
- Select the relevant filters to narrow your reporting scope.
- Review average scores per question. You can sort by performance or by question number using the controls below the filters.
- Review performance analysis by school. Use the sub-filter above the table to compare by school, teacher, or class.
The color coding in Question Analysis uses a heat-map format and is not tied to your district’s performance band definitions.