

Report data can take up to about an hour to populate after students submit or you finish grading. If a status looks stale, check the student’s attempt in the Live Class Board before assuming something is wrong.
Access the Report
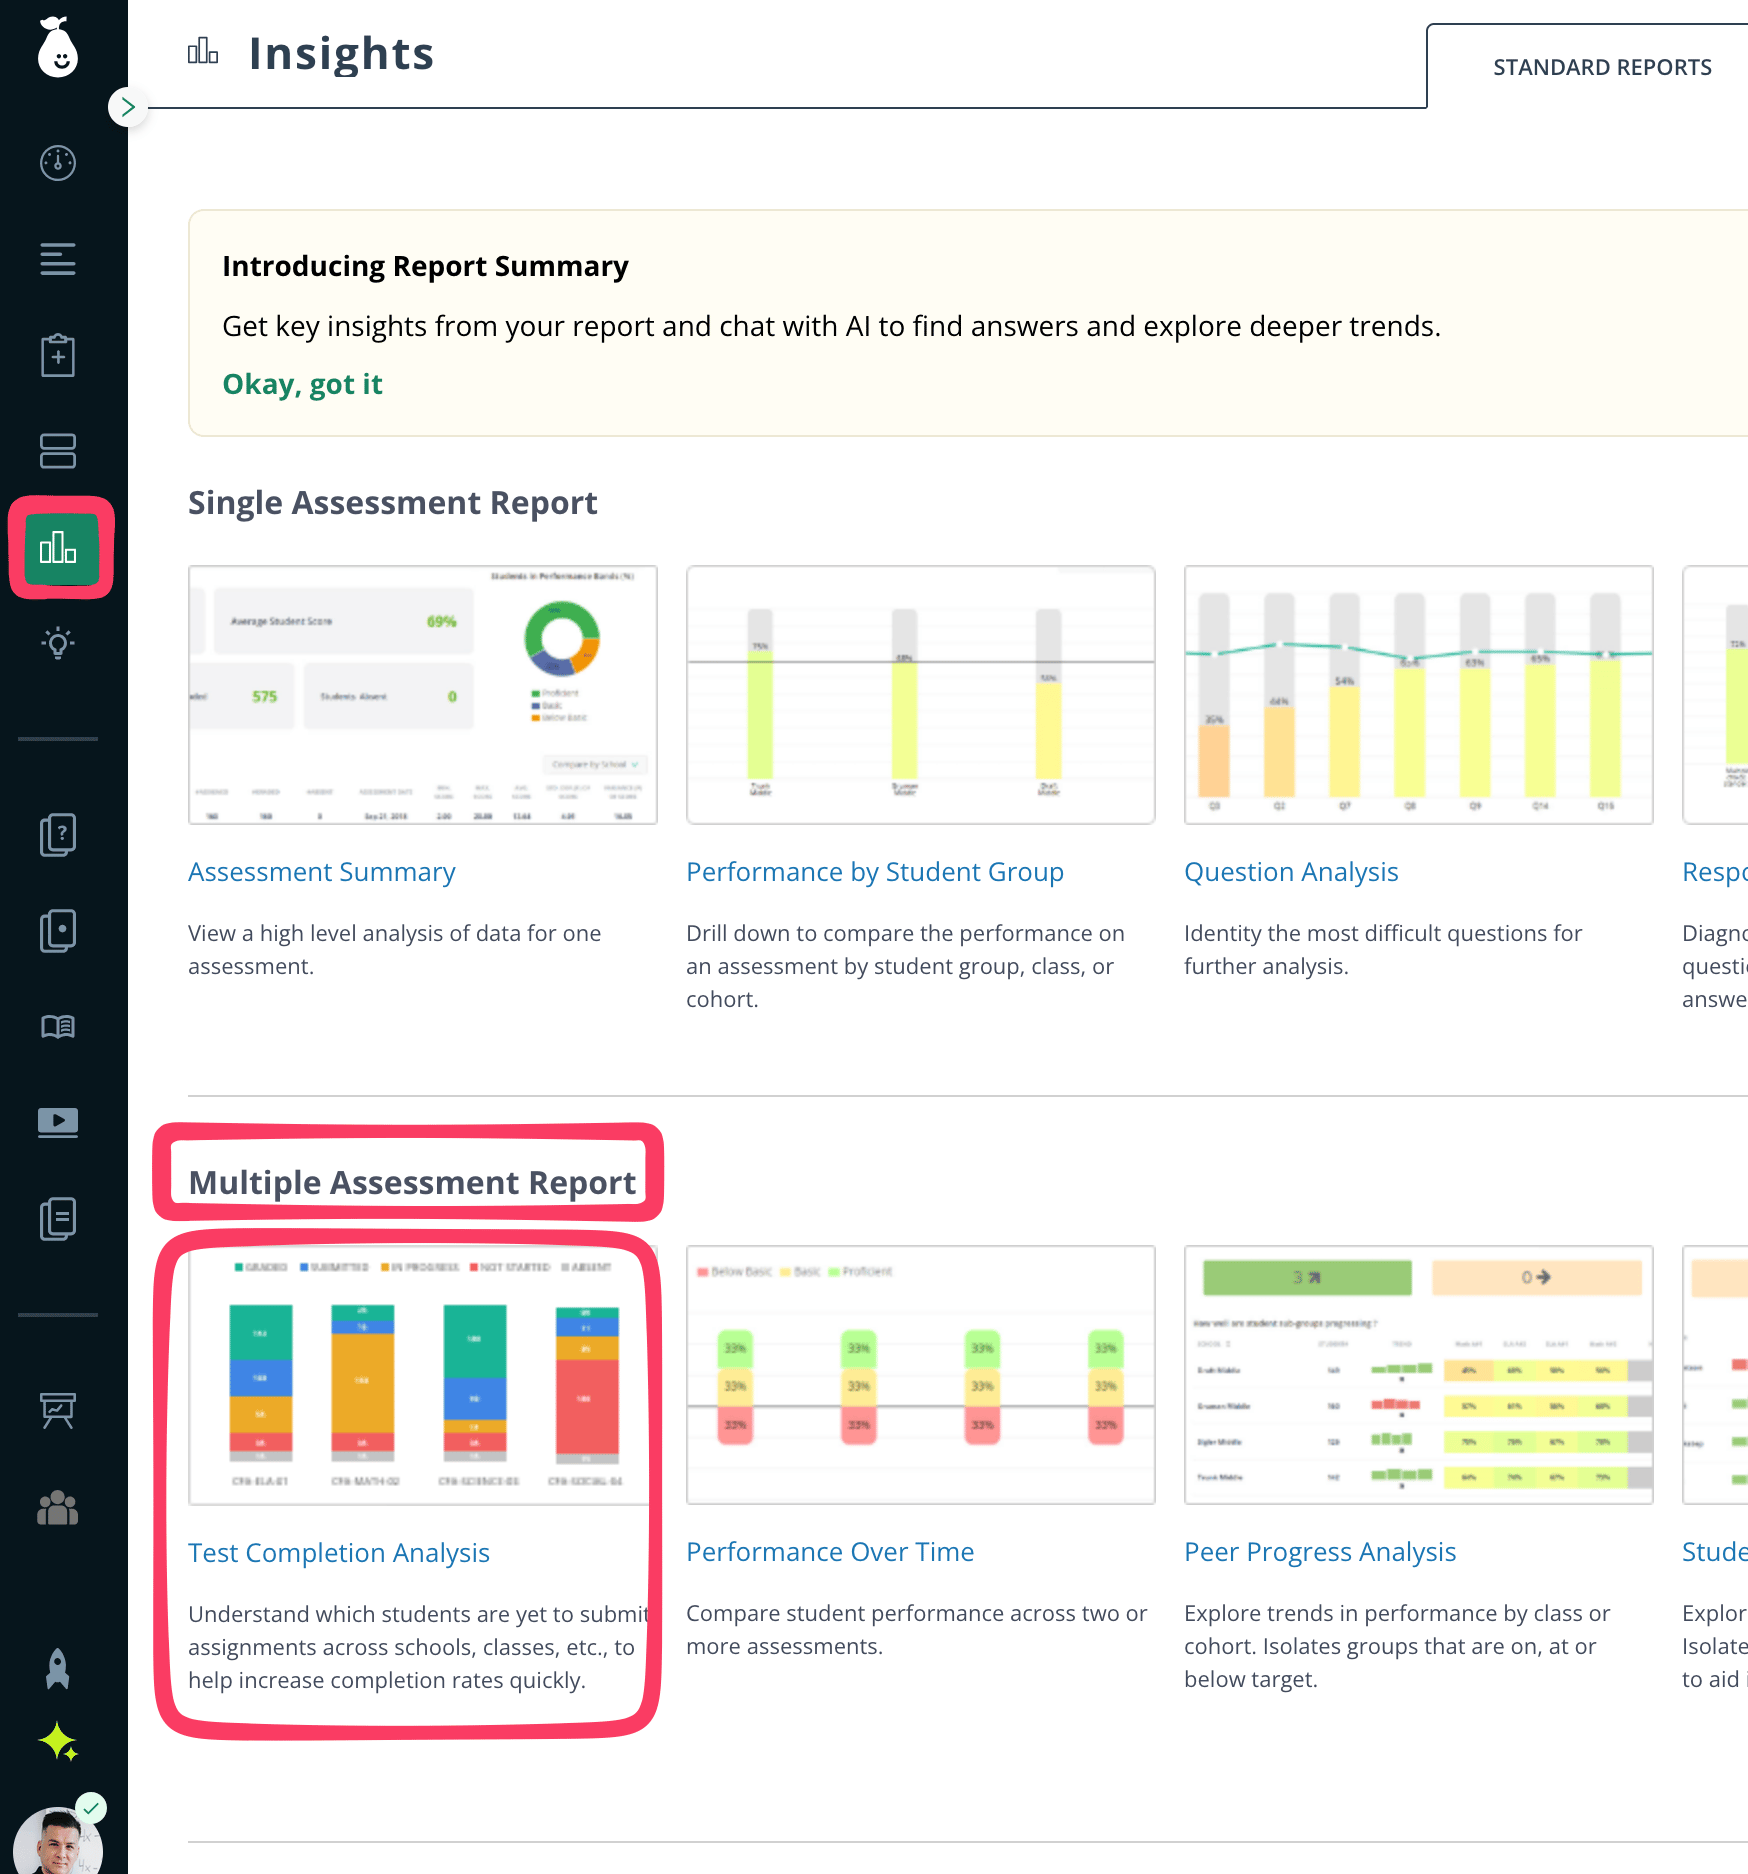
- Click Insights in the navigation menu.
- Under Multiple Assessment Report, click Test Completion Analysis.
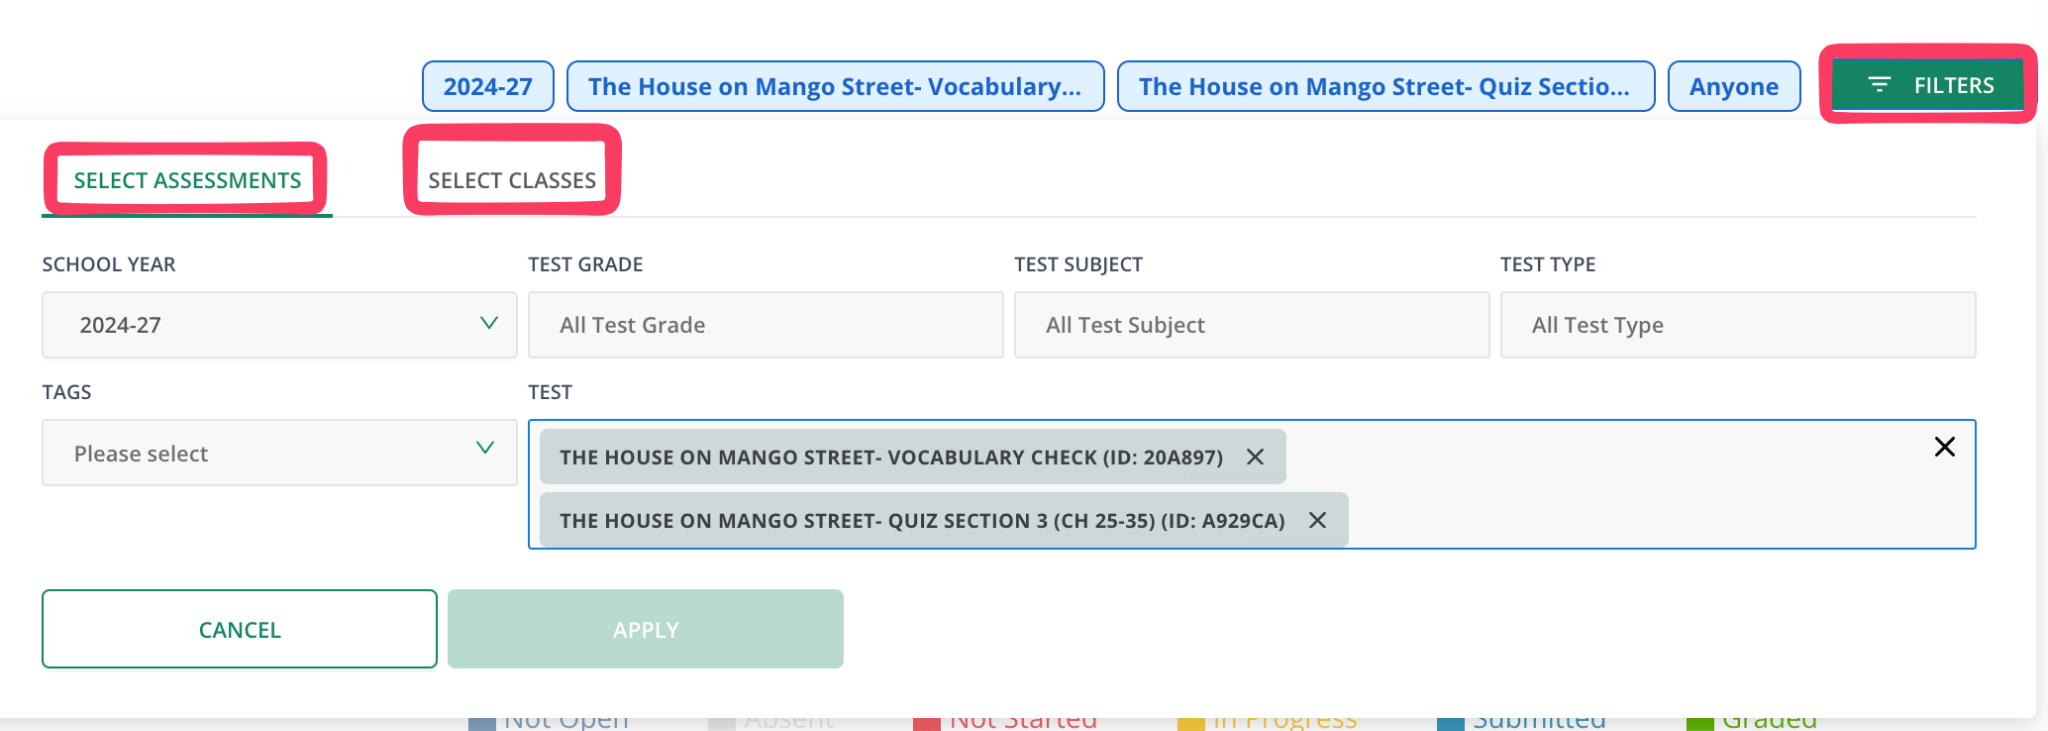
- Click Filters, then use the Select Assessments and Select Classes tabs to choose a school year, assessment, class, and student group.
- Click Apply.
Read Pear AI’s Summary
At the top of the report, Pear AI generates a short written summary of the selected data — overall completion and status percentages, classes or assessments that need follow-up, and other notable patterns.
Read the Completion Chart
The stacked bar chart shows the distribution of student completion status for each selected assessment. Hover over a section of a bar to see the test name, date, number of students assigned, and percentage graded.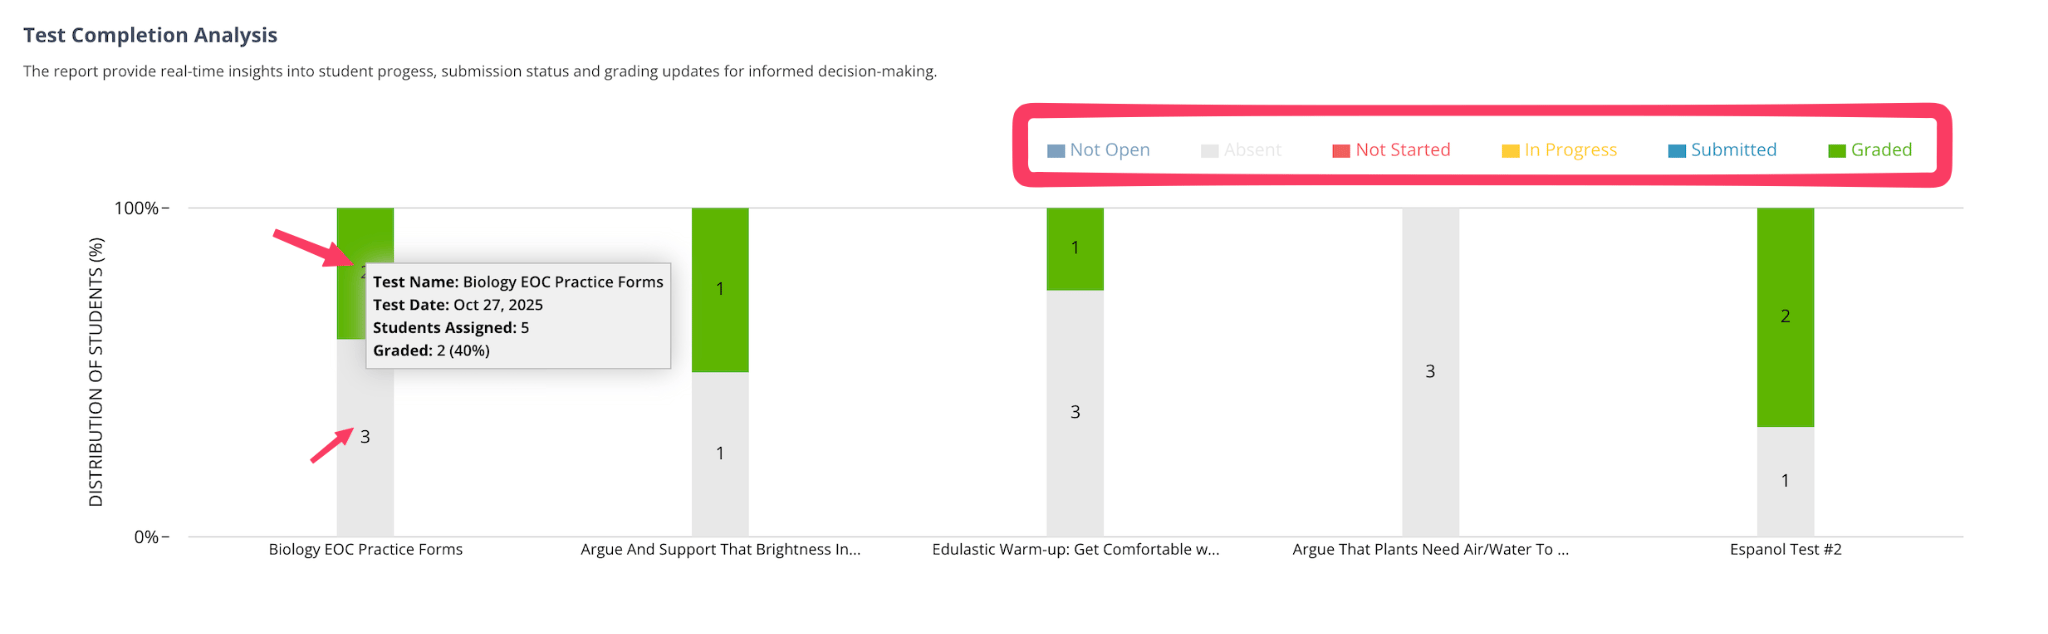
Submitted doesn’t mean graded. A student with manually graded questions (like constructed responses) stays in Submitted until you finish scoring their work.
Read the Completion by Class Table
The table below the chart breaks completion down by assessment and class: number of students assigned, a count in each status column, and the graded count. Click View Performance to open that assessment’s performance report, or Copy Report Link to Share to share this view with someone else.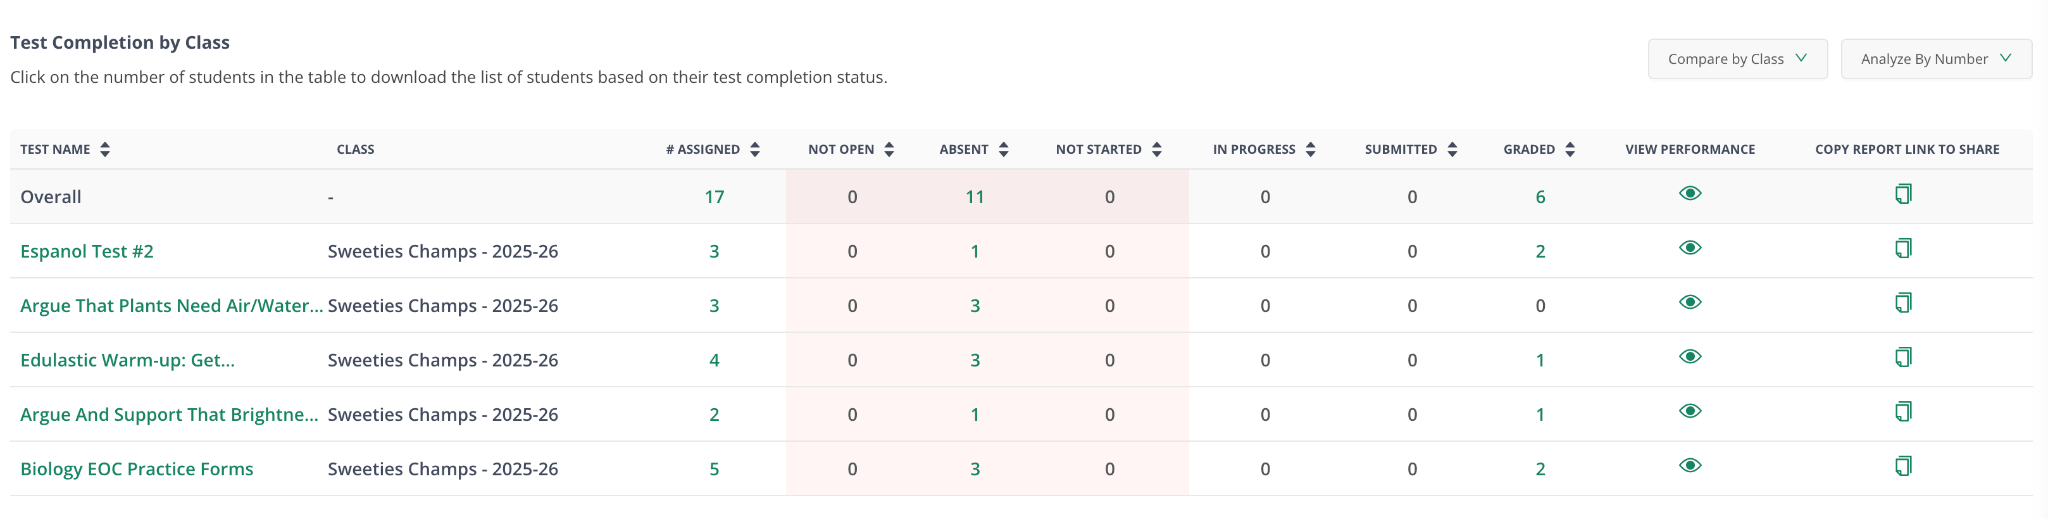
Compare and Analyze Data
Use Compare By to change how the table is grouped — by Class, Student Group, Race, Gender, FRL Status, ELL Status, or IEP Status. Use Analyze By to switch the table between percentages and numbers.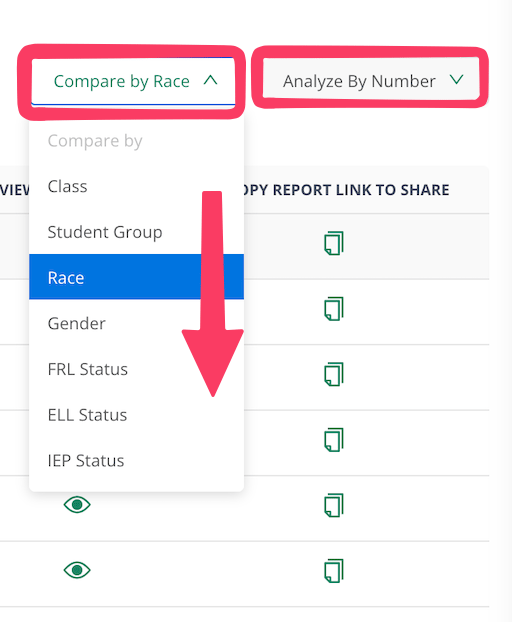
FAQ
What does the Pear AI summary show? A generated summary of completion trends based on your selected filters, so you can spot students or classes that need attention without reading the full table. Can I download the list of students in a specific status? Yes. Click the number in that status column in the completion-by-class table. Why is a student shown as Submitted instead of Graded? The student submitted the assessment, but grading isn’t complete yet — usually because a constructed-response or other manually graded item is still pending. What does Absent mean? The student was manually marked absent, or didn’t access the assessment before the testing window closed. Can I share this report with others? Yes. Use Copy Report Link to Share in the completion-by-class table to copy a direct link. Why don’t I see all completion statuses? Only statuses that apply to your selected assessments and filters are shown. A status with zero students may not appear in the chart at all.Related Articles
Interpret Multiple Assessment Report
See how Test Completion Analysis fits alongside the other Multiple Assessment Report types.
AI Summary in Insights and Data Studio
Understand how Pear AI generates summaries across Insights and Data Studio reports.