Review class and student performance across six report tabs, Summary, Sub-Group, Analysis, Frequency, Standards, and Students, to spot trends.
The Assessment Summary tab in Pear Assessment Insights provides a quick overview of your most recent assessment, including the average score across all classes, the ability to filter results by grade, subject, test type, tag, and test name, and the option to share, print, or download the report as a PDF or CSV file.
The Single Assessment Report is available with Teacher Premium or Enterprise subscriptions. All assessments must be in Done status for data to be available.Scores are usually immediate, but there can be a lag of about one hour before reports are populated. You will only receive data for students who are marked as absent or who have submitted. Students with ungraded constructed responses will also appear in the report.
The Assessment Summary report summarizes student progress on the most recent assignment or test. The data is collected from all classes that received the assignment or test. The report lets teachers:
Apply filters to report on specific assignments or tests, which will carry through to each tab
Check the average score (%) across all classes for the latest assessment and compare class-level average score (%)
Review each tab of the report in depth
Filter results by Grade, Subject, Test Type, Tag, and Test Name
The report is segmented into six tabs that teachers can review:
The Sub-Group tab explains the average class performance, which can be evaluated by score percentage, raw score, above/below standard, or proficiency band. Teachers can compare the average performance by:
The Analysis tab shows student average scores per question based on time spent, which can be filtered by question or performance. Teachers can hover a question for more detailed information about the data.
The Standards report tracks student success per standard. Standards are set by administrators in the district or school settings depending on their levels of permission.
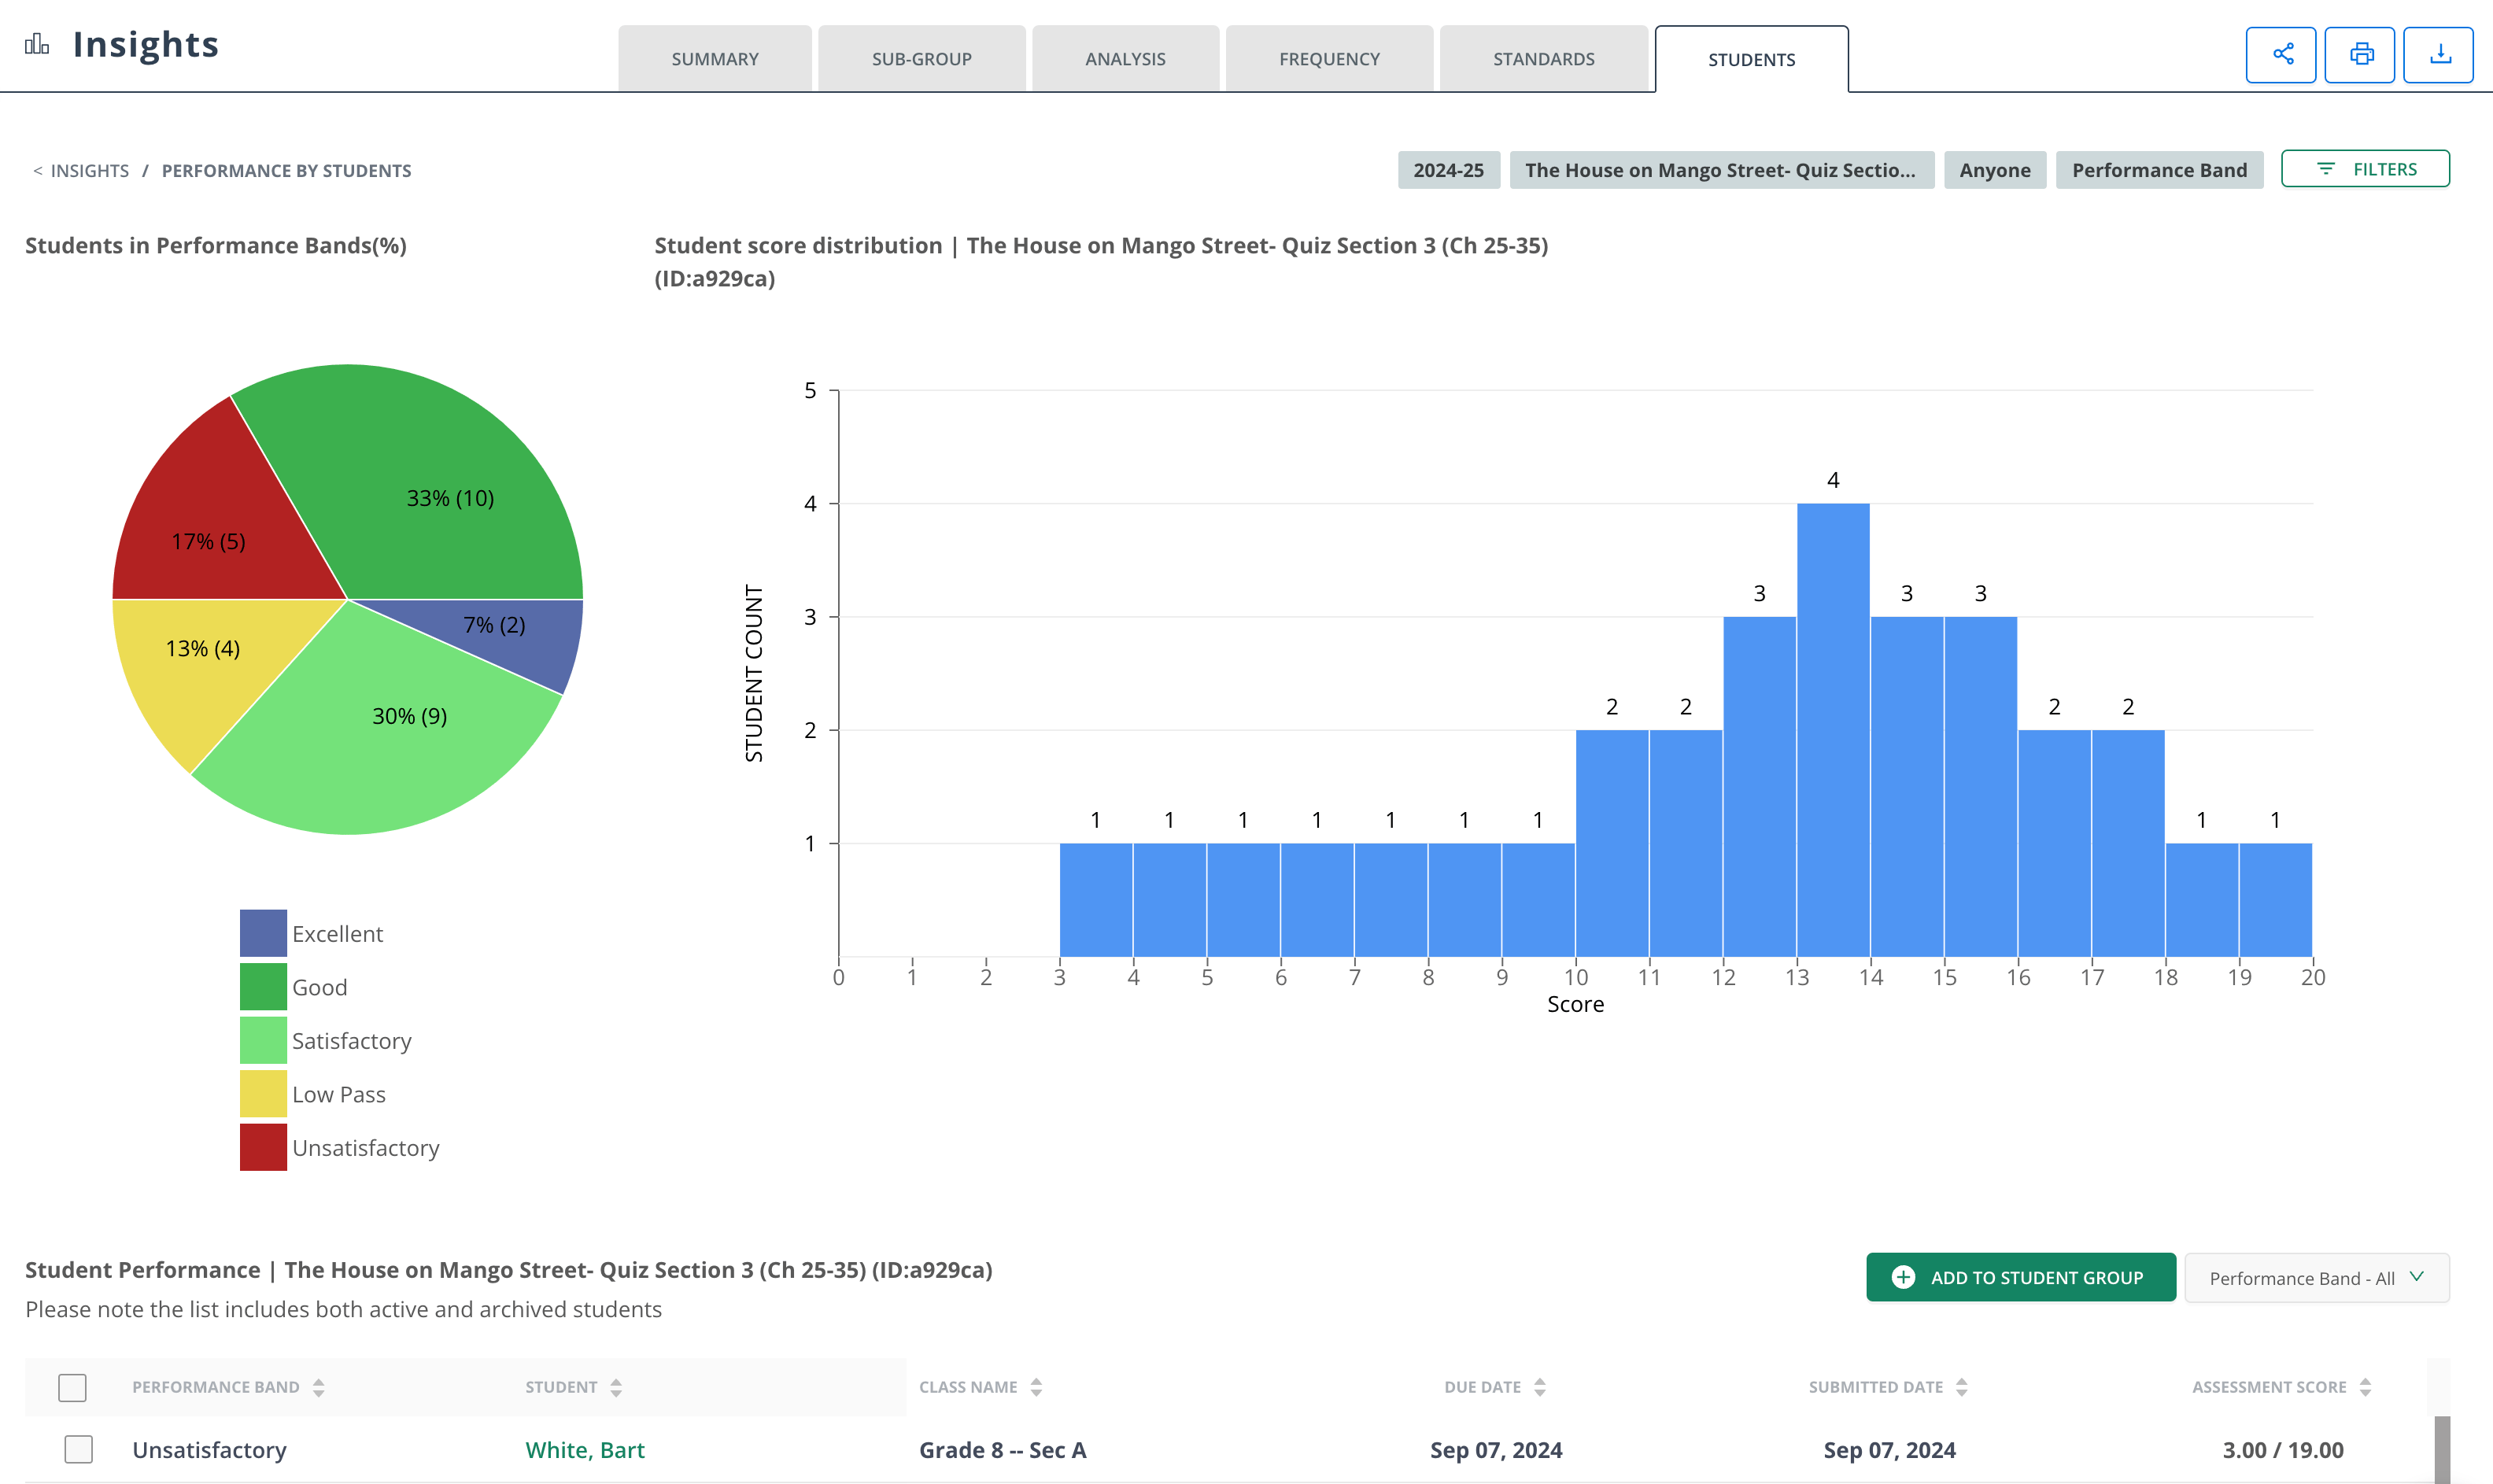
The Students report shows student performance per band. Teachers can click on each score to filter student scores by it and then add students to a Student Group if further action is needed, such as intervention.