

Pre vs Post Comparison
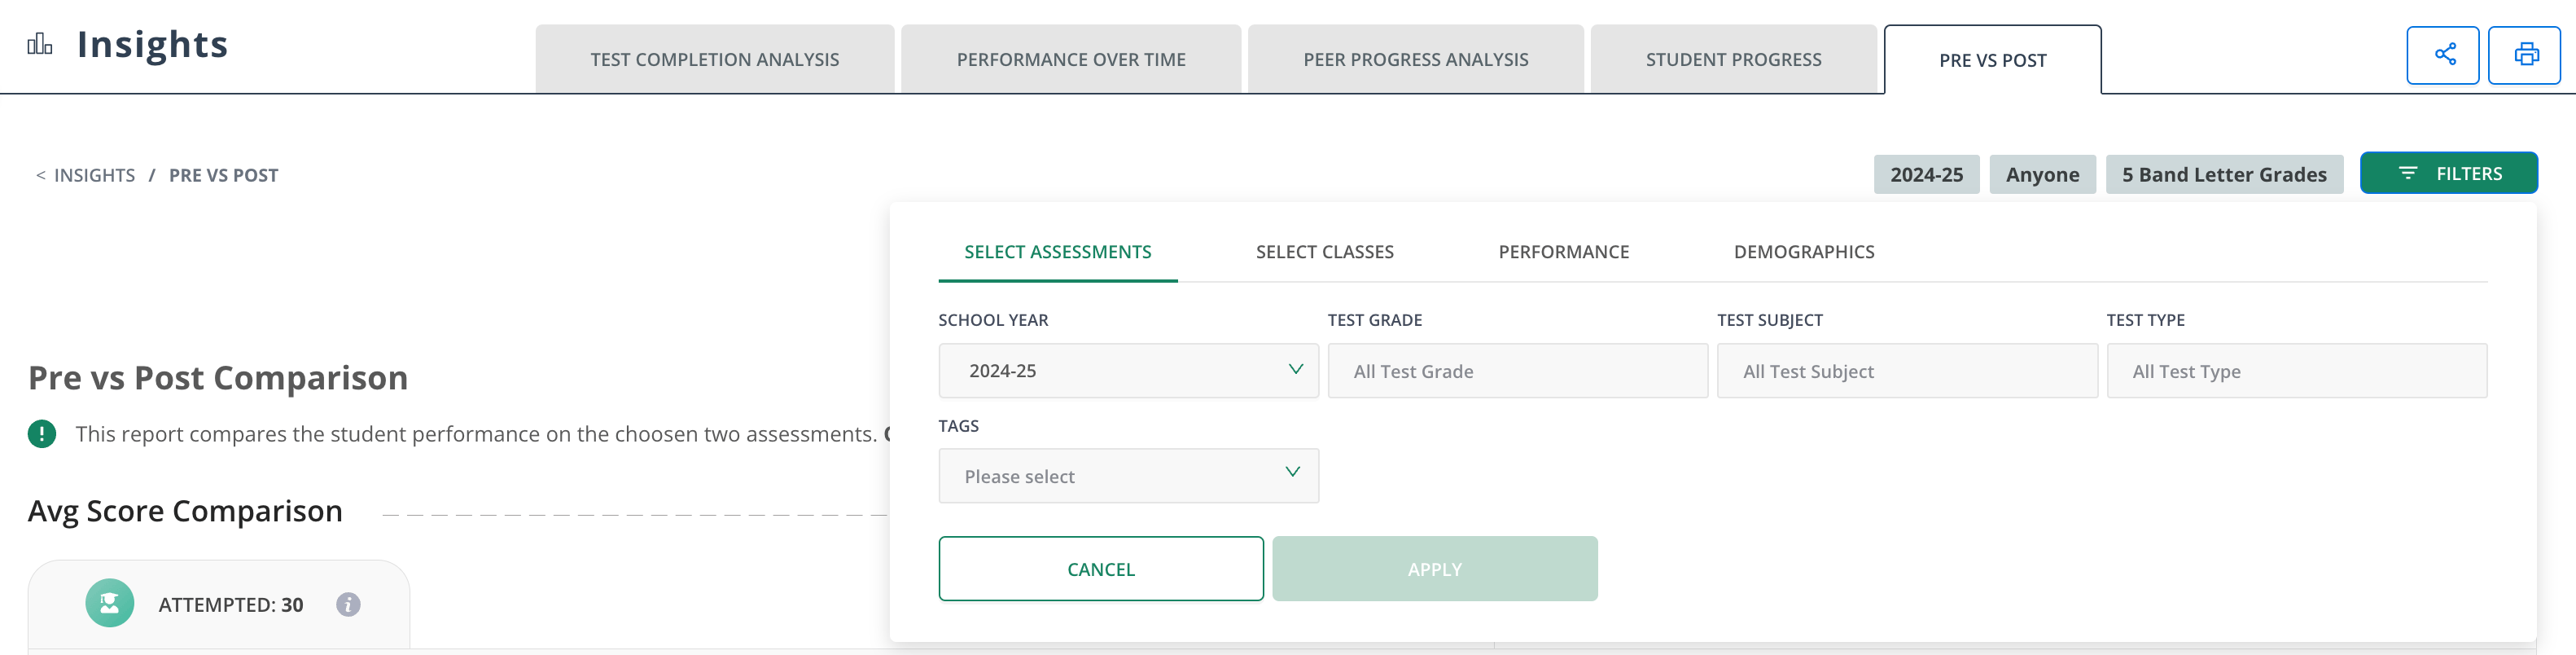
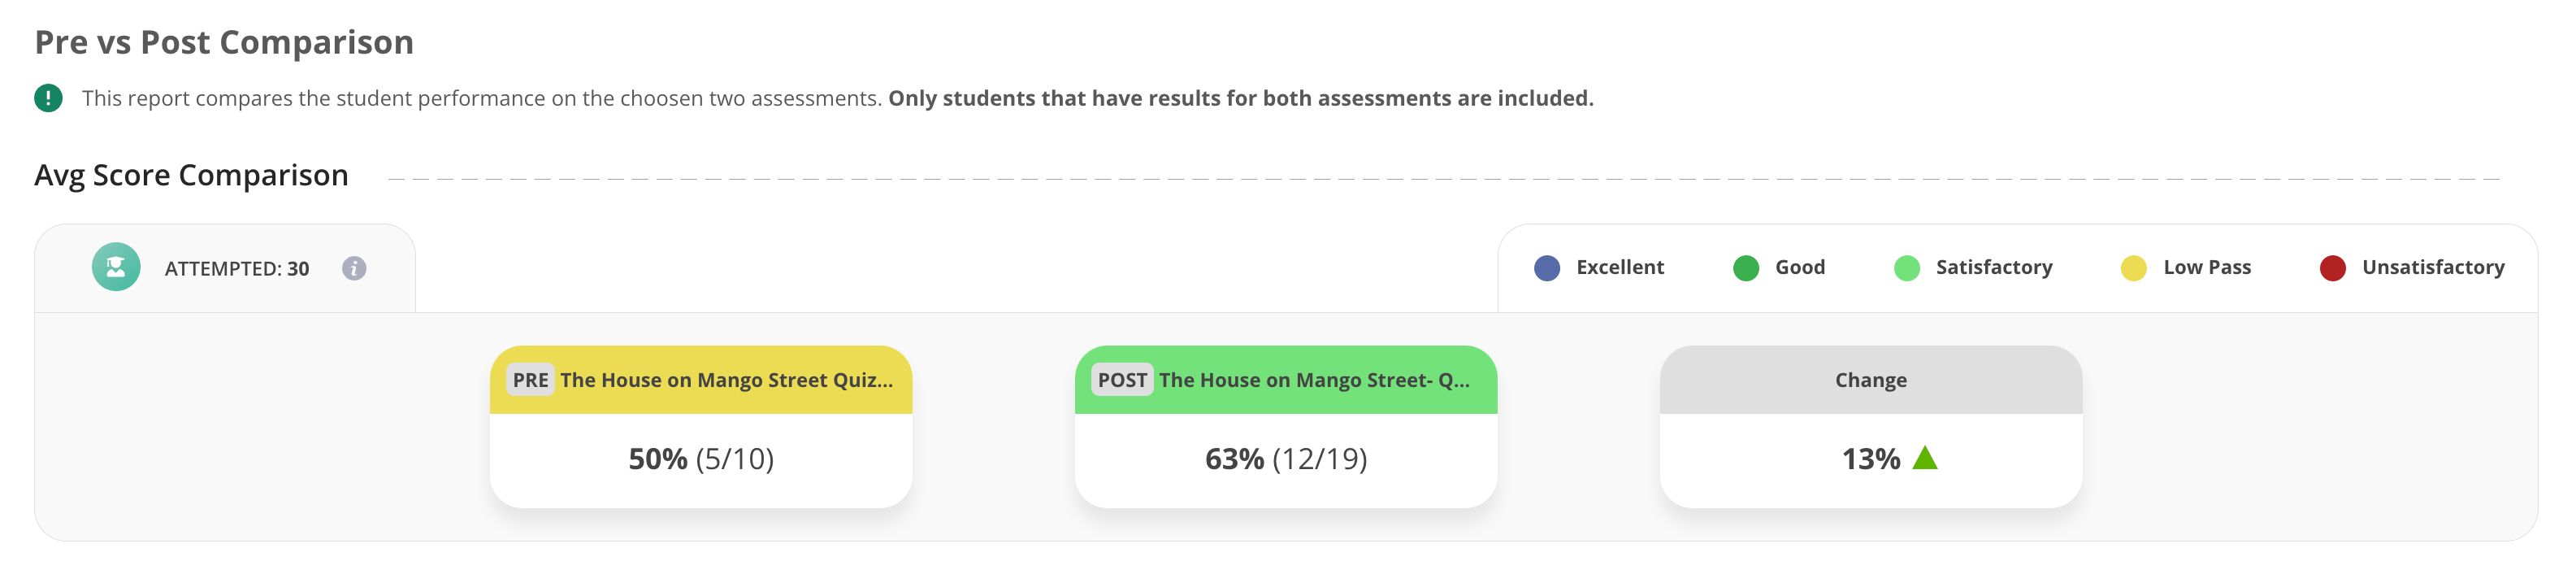
The Pre vs Post Comparison section compares the scores of two assessments that students have submitted. The first value shows the average score for the pre-test (for example, 5 out of a max score of 10). The second value shows student proficiency on the post-test (for example, 12 out of 19). The Change column highlights the difference between the two assessments.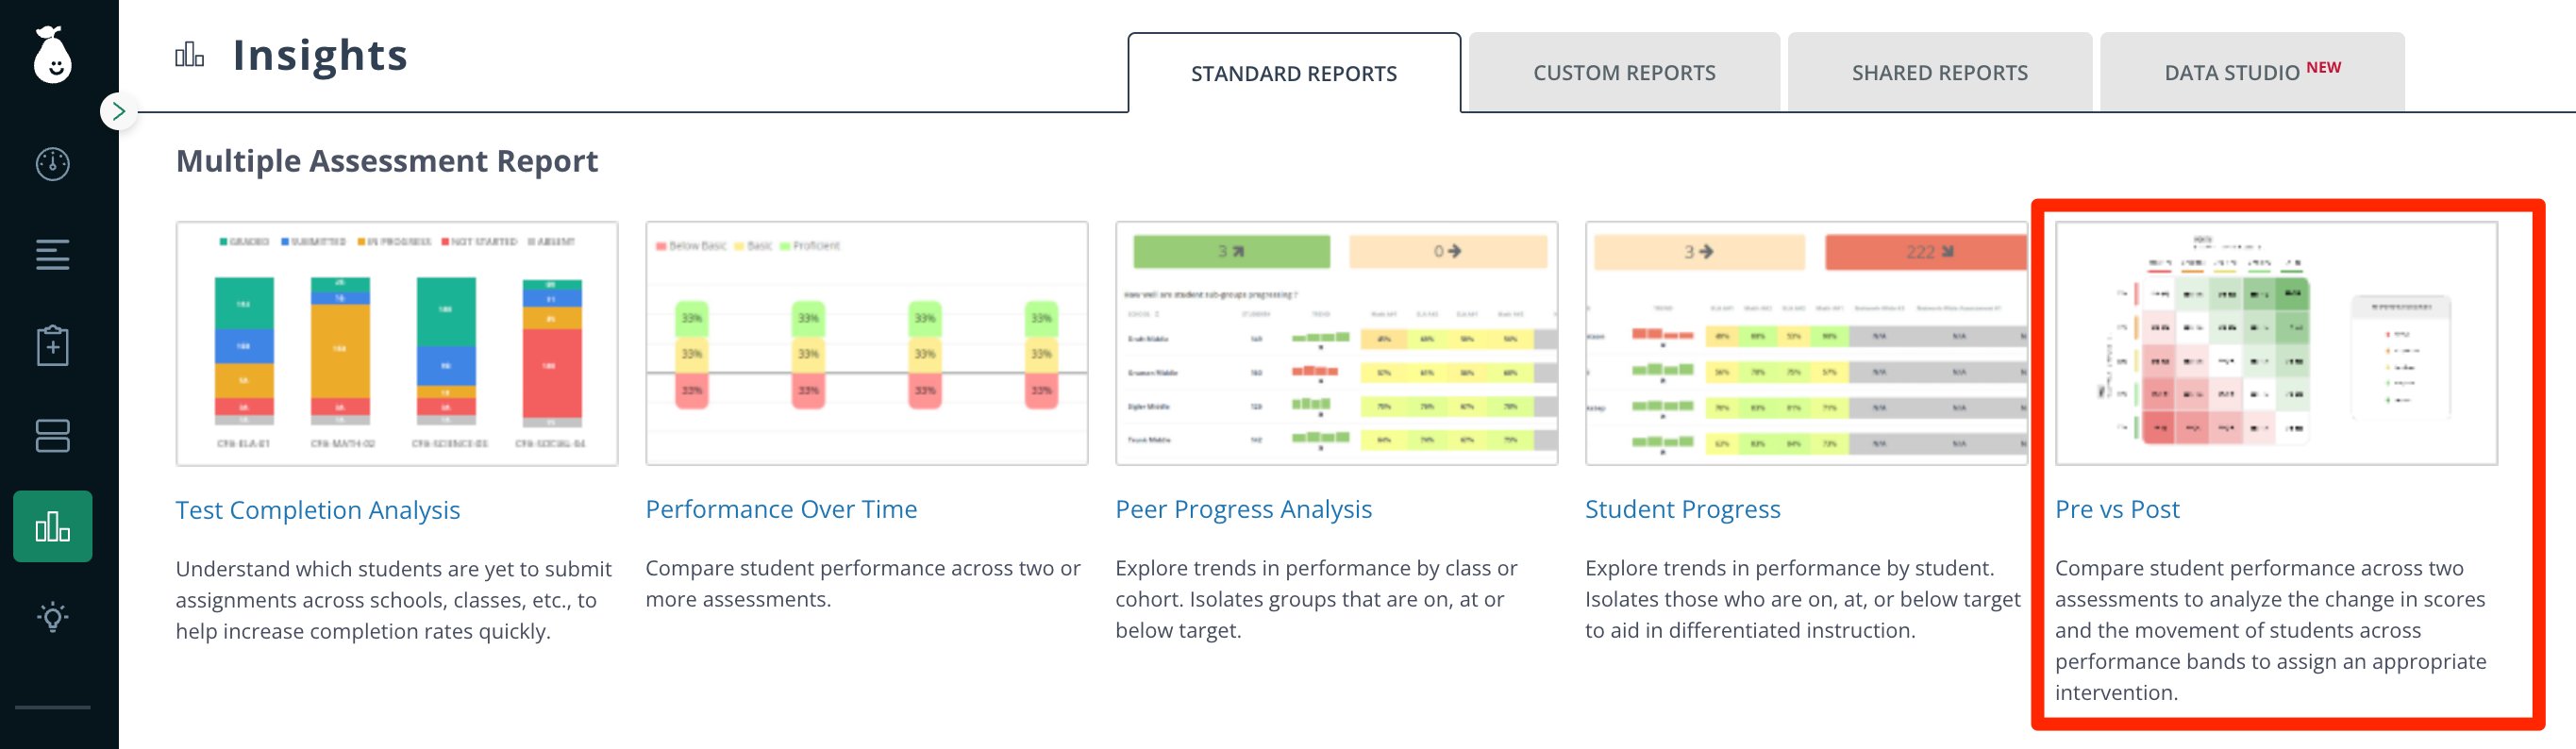

Performance Band Movement
The Performance Band Movement section shows a comparison of band jumps between the pre-test and the post-test. Data can be viewed by score or by percentage. Select any square in the visualization to see the performance change for students in that cell.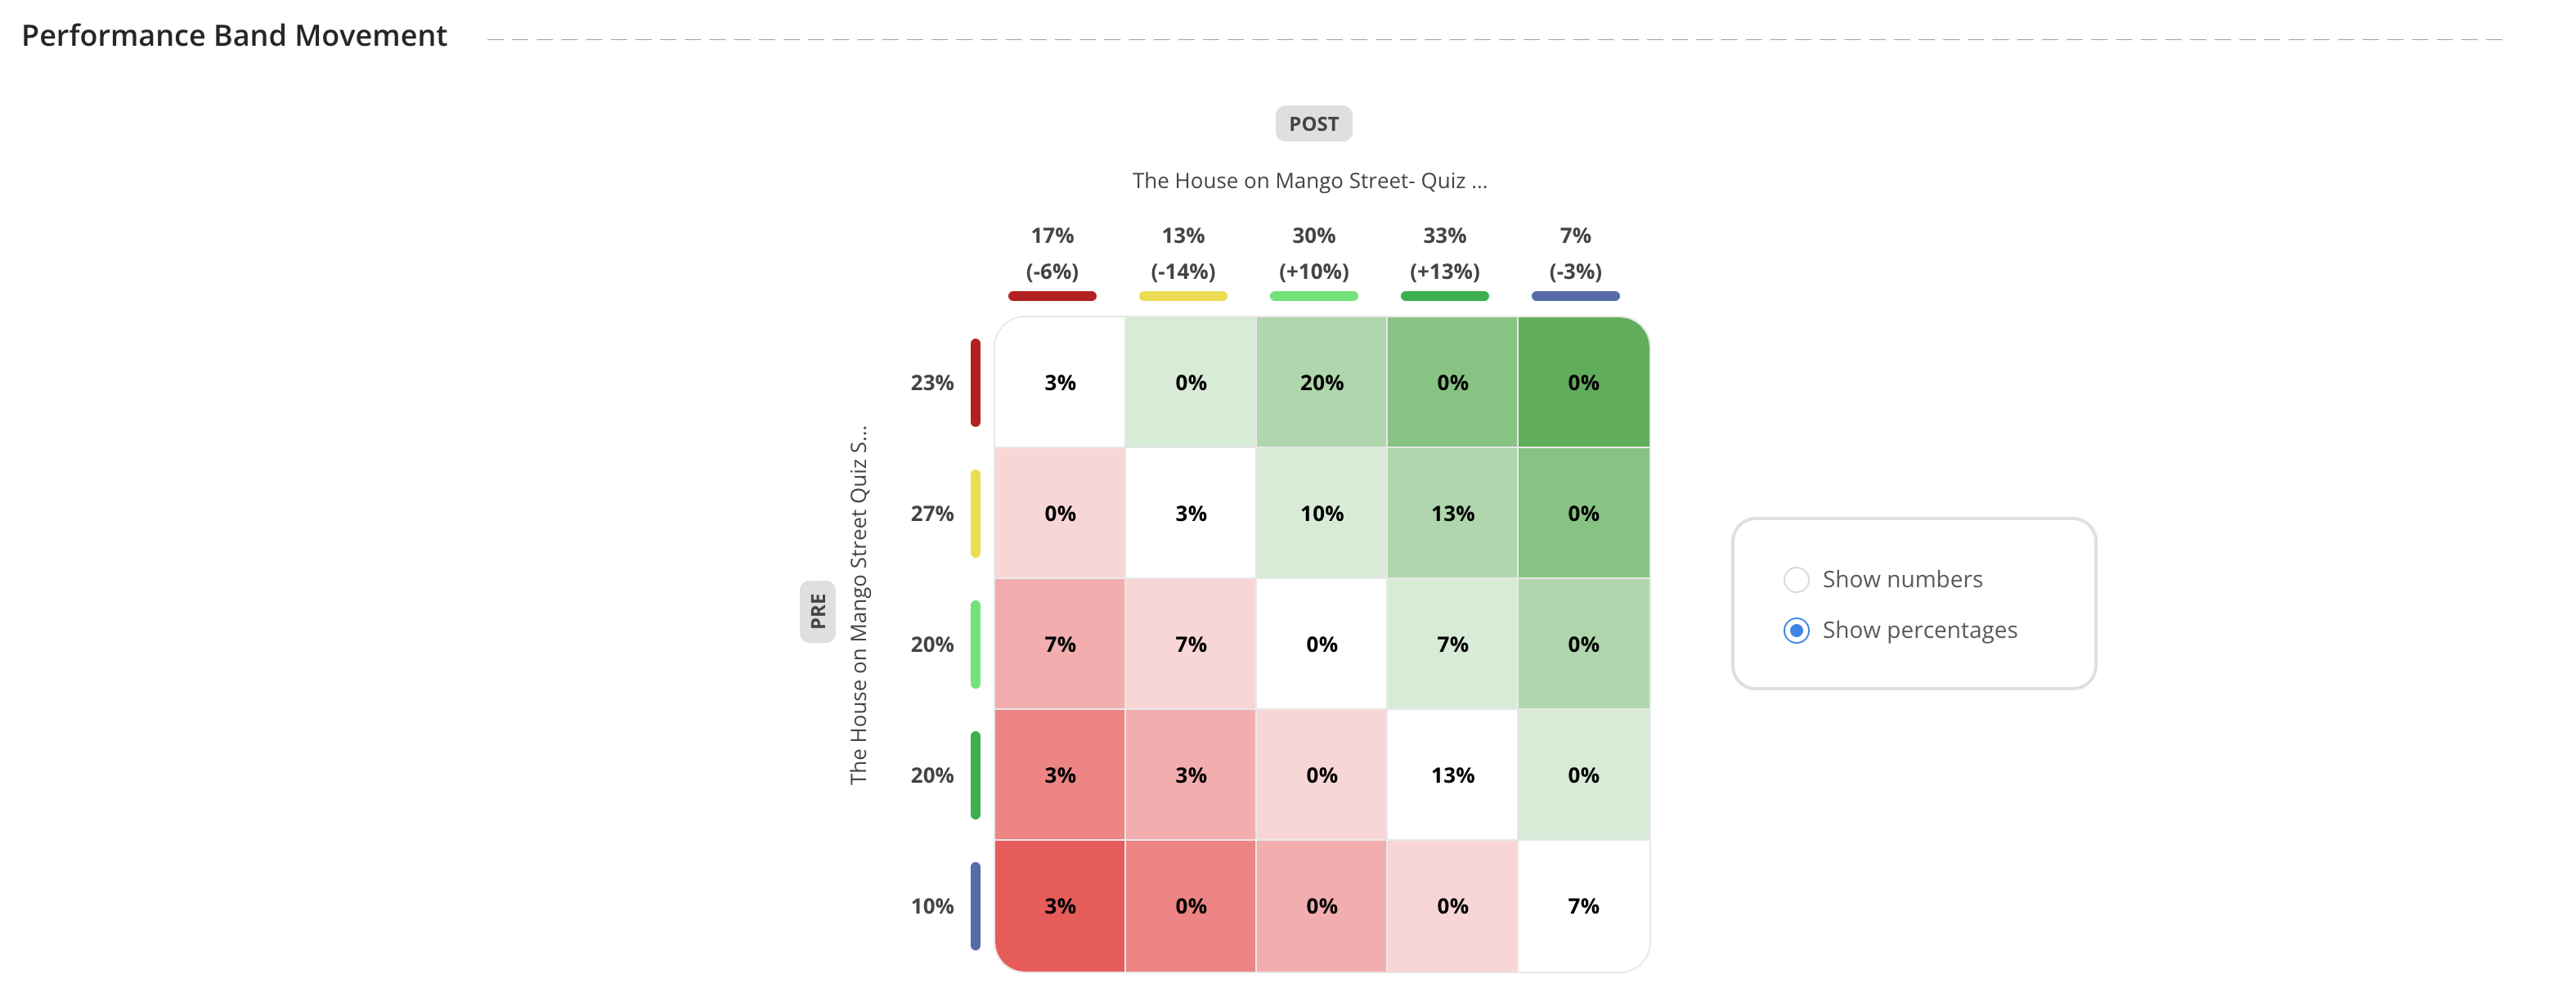
Performance Change
The Performance Change section shows how individual student progression between the two tests falls within the performance bands. Results can be viewed by percent score or raw score and filtered by the following categories:- Class
- Student
- Race
- Gender
- FRL Status
- ELL Status
- IEP Status
- Hispanic Ethnicity

Resources
Multiple Assessment Report: Comparing Two Or More Assessments
Learn how to use the Multiple Assessment Report to compare results across two or more assessments.